Rules to Better Application Insights - 13 Rules
Enhance your web application's performance and reliability with essential rules for using Application Insights. These guidelines cover everything from setup to monitoring and alerting, ensuring you can effectively analyze usage and address performance issues over time.
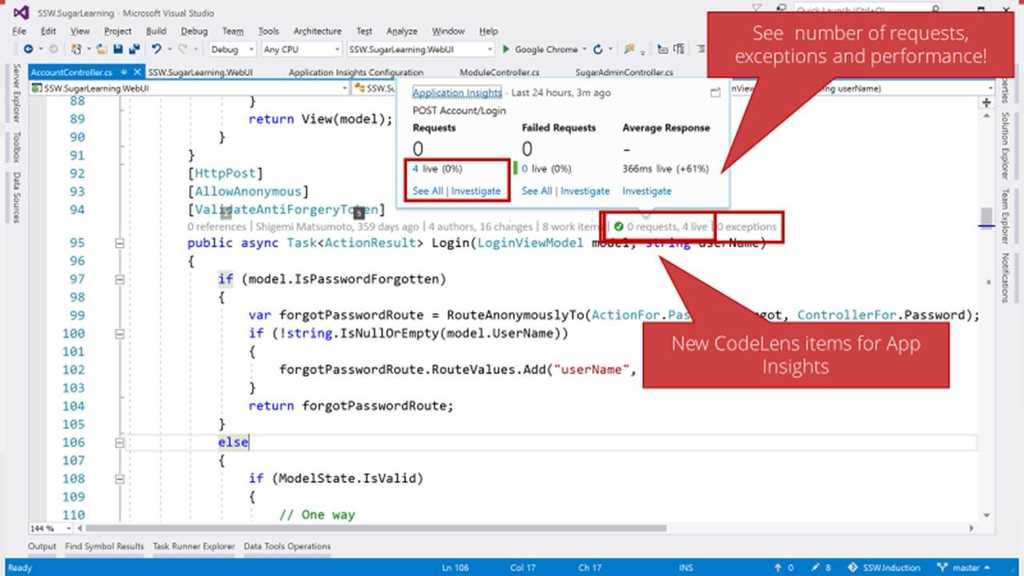
Knowing the holistic health of your application is important once it has been deployed into production. Getting feedback on your Availability, errors, performance, and usage is an important part of DevOps.We recommend using Application Insights, as getting it set up and running is quick, simple and relatively painless.
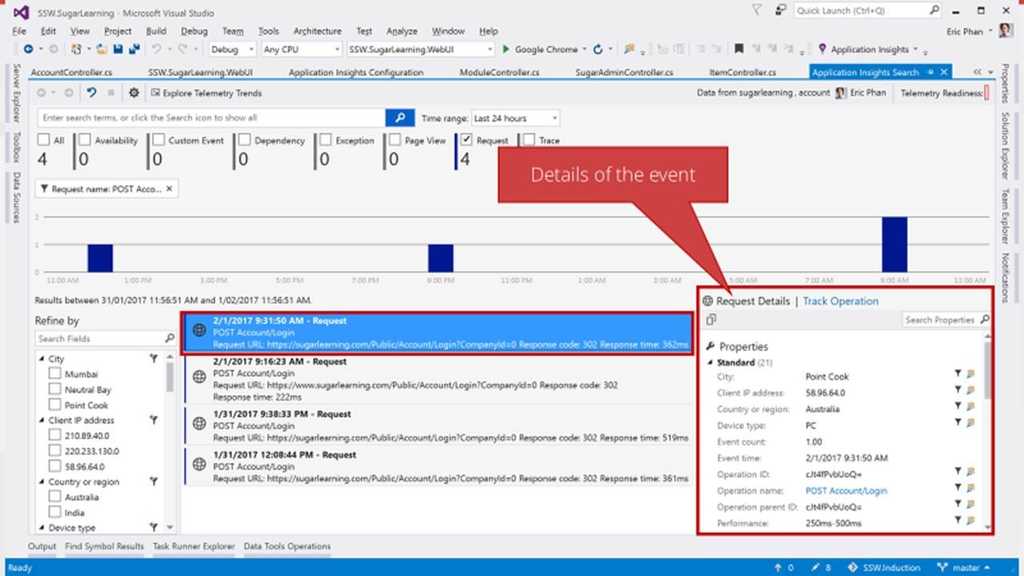
Application Insights will tell you if your application goes down or runs slowly under load. If there are any uncaught exceptions, you'll be able to drill into the code to pinpoint the problem. You can also find out what your users are doing with the application so that you can tune it to their needs in each development cycle.
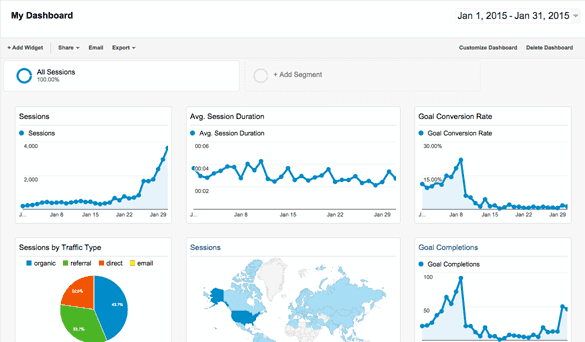
Figure: When developing a public website, you wouldn't deploy without Google Analytics to track metrics about user activity. 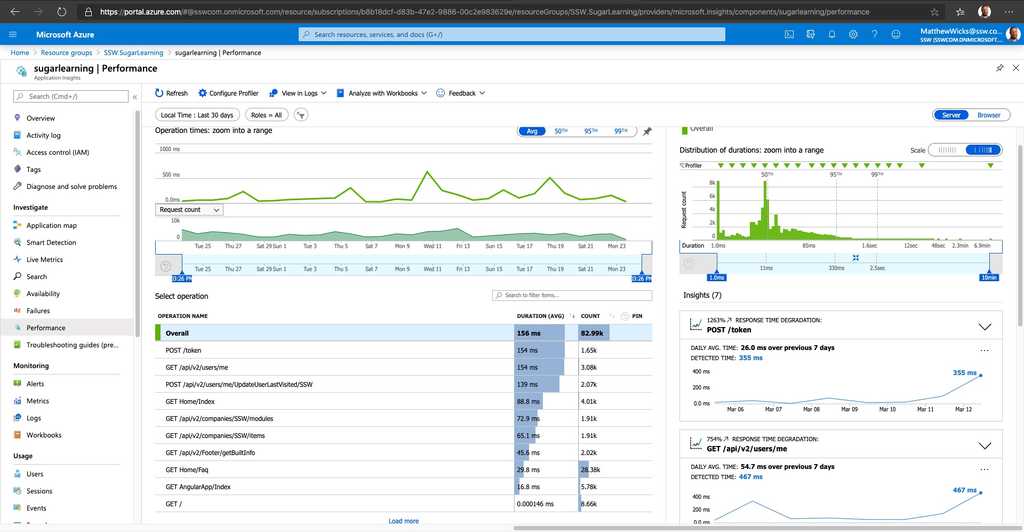
Figure: For similar reasons, you shouldn't deploy a web application without metric tracking on performance and exceptions - You need a portal for your app
- You need to know spikes are dangerous
-
You need to monitor:
- Errors
- Performance
- Usage

Figure: Spikes on an Echidna are dangerous 
Figure: Spikes on a graph are dangerous To add Application Insights to your application, make sure you follow the rule Do you know how to set up Application Insights?
Can't use Application Insights? Check out the following rule Do you use the best exception handling library ?
The best approach of setting up Application Insights in SharePoint is a bit different than adding to normal web application.
Note: To check the normal way of setting up Application Insights via Visual Studio, please read "How to set up Application Insights"
With a web application you are developing you have full control of web.config and have access to it in your Visual Studio project, and can follow "How to set up Application Insights" to set up Application Insights. This way Visual Studio will do all the modifications for you automatically.
But when you develop on SharePoint, you do not have a full copy of web.config in your Visual Studio project, the web.config will be initialized on the SharePoint server when a new SharePoint site is created. This means Visual Studio cannot be used to update the web.config for you. Although you can modify SharePoint web.config via coding, that involves lots of development and testing work against your SharePoint server.
The best process to implement Applications Insights in SharePoint can be split into two parts:
- Implement App Insight JavaScript in master page (via Visual Studio) or web pages individually via embedded code, there are two good articles include the detail steps:
- Monitor a SharePoint site with Application Insights
- Understand your SharePoint usage with Application Insights/
-
Use Application Insights Status Monitor configuration tool to add DLLs reference and update web.config (no coding work involved), there are two articles include the detail steps:
The easiest way to get started with Application Insights is to follow the documentation on Microsoft Learn.
Lets take a look at the overview and our tips to help you get the most out of Application Insights.
An overview of the setup steps
Application Insights requires that you make 2 general modifications to your application:
-
On the client side, manually add a Javascript tracker to your web page header (i.e. by placing directly on each page or through a "master page" or "layout template"), this modification enables the "browser page loading time" monitor and can track client-side exceptions:

Browser side stats have been enabled with the JavaScript tracker - On the server side, install and configure the Azure.Monitor.OpenTelemetry.AspNetCore package. These modifications enable the "server response time", "server request" and "failed requests" monitors.

Server side stats have been enabled now that it has been added to the ASP.NET pipeline Tips
Now that you've added Application Insights, what can you do with it?
Add Health Checks
Application Insights makes it easy to check the health of your app and its infrastructure - see Do you Health Check your infrastructure?
Create a custom dashboard
A custom Application Insights dashboard makes monitoring your application much easier. The KPIs that you would typically monitor for each component of your application are:
- How many requests each component is receiving.
- How long requests are taking.
- How many exceptions and dependency failures are being experienced by the app.
- How many requests are failing.
When designing your custom dashboard:
- Size charts based on their importance.
- Lay charts out so that it is easy to compare points in time between charts.
- Ensure that metrics with different scales are not on the same chart. For instance, the average server response time may vary between 250 and 500 milliseconds, but that variance may not be easily visible if the maximum server response time is plotted as taking 40 seconds on the same chart.
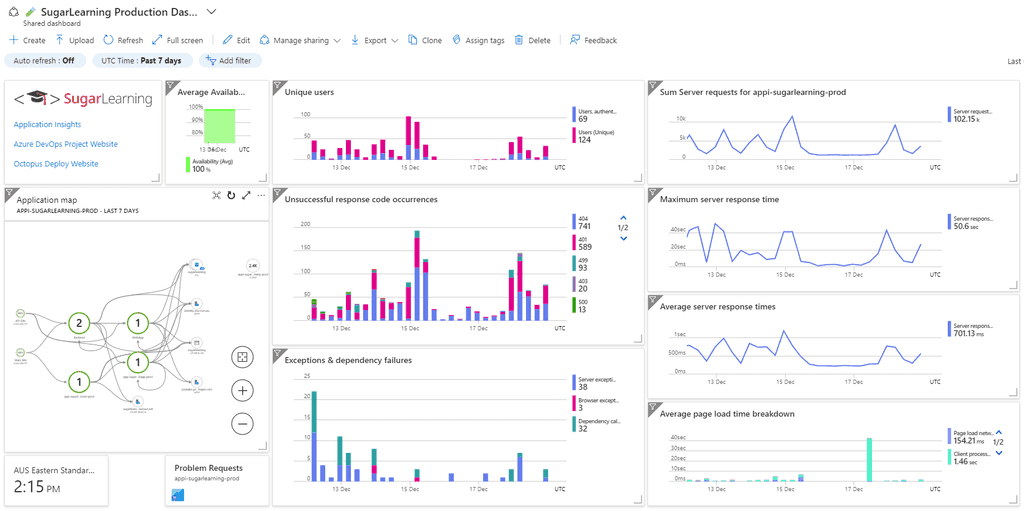
Good example - Custom dashboard demonstrating the above points -
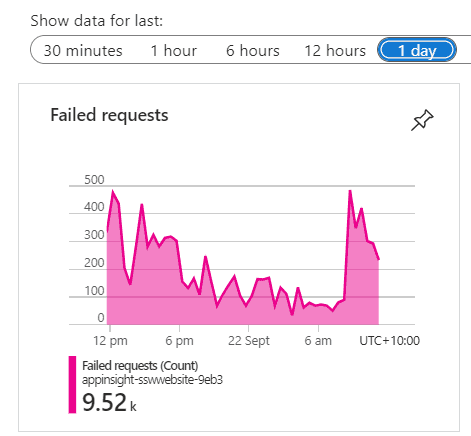
Application Insights provide crucial insights into the health and performance of the application. Failed Requests allow the DevOps specialists to identify the specific errors and exceptions occurring in the application. However, keeping Failed Requests clean is crucial to troubleshoot and pinpoint the root causes of the problems efficiently. A cluttered failed requests list filled with irrelevant entries can make it difficult to identify the critical issues that require immediate attention.
Video: Do you keep Failed Requests clean? (5 min)
Understand your Failed Requests
When cleaning up Failed Requests, it is important to identify the patterns between frequent offenders and categorize them into the following three categories:
- Irrelevant – Failed Requests that you expect but cannot do anything about.
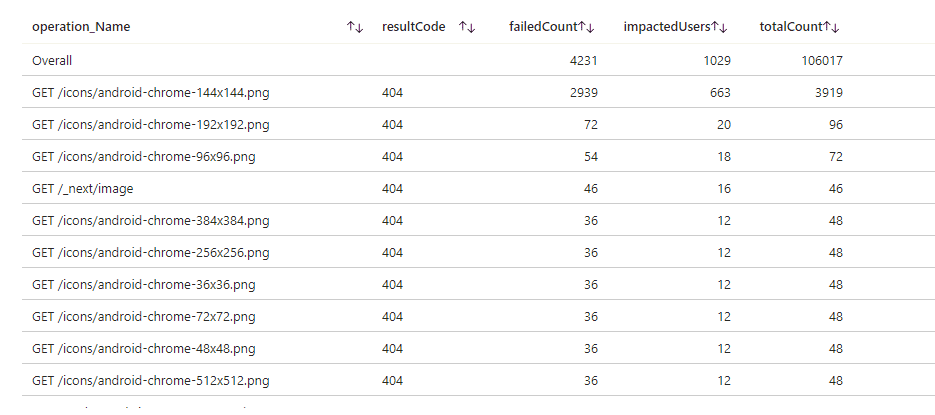
Examples: 404 responses to “/autodiscover.xml”, “/robots933456.txt”. - Probing Attempts – Inbound requests targeting non-existent URLs in your application. These requests often originate from bots seeking common vulnerabilities. A properly configured Web Application Firewall (WAF) should identify and mitigate such traffic i.e. this should be empty. Examples: 404 responses to requests for '.php' or 'Wordpress' endpoints not present in your .NET application.
- Fixable – Failed Requests that you identify as bugs in your application.
You can identify these requests by their URL belonging to the real endpoints or files in your application.
Create PBIs for these bugs, and if you cannot fix any of them yourself, pass them on to the people who can.
Examples: 404 responses from missing images, 400 responses from API.
Note: Not everything you encounter can be matched to a pattern or fixed straight away.
If that is the case, continue to other requests. As the logs become cleaner, it will get easier to understand the problems with the left-over requests.
Tip: Splitting the chart based on response codes may make patterns clearer. For instance, 500 responses will almost always be fixable bugs worth investigating.
Clean your Failed Requests
While the Fixable Failed Requests can be dealt with by resolving their underlying causes, the other two categories will continue to clutter your Application Insights.
You can use Application Dashboard and Azure Workbook to filter out any unwanted failed requests and display only useful information.
Application Dashboard is a customizable interface that provides an overview of an application's performance and health. You can access it at the top of the Overview page of your Application Insights. If the Application Dashboard was not yet created, you must have a Contributor Role in that Resource Group. A new Application dashboard automatically displays various charts, metrics, and alerts to monitor application behavior.
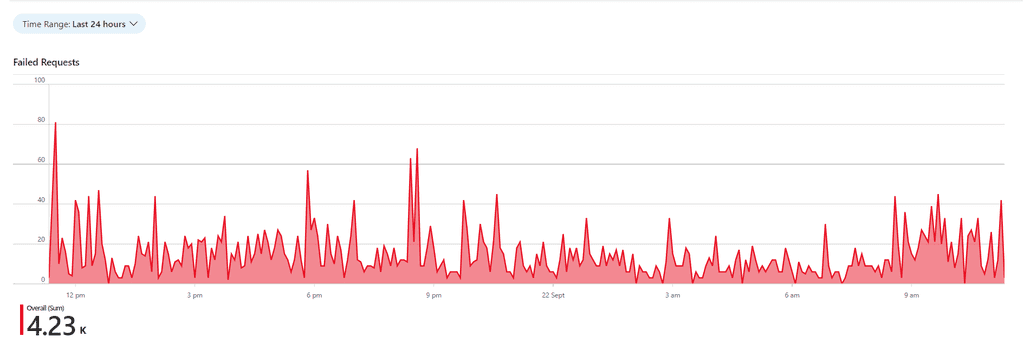
Azure Workbooks is a tool that allows users to create customized dashboards for data visualization and reporting on Azure resources. You can use it to create charts and tables with custom queries in Kusto Query Language (KQL), and then pin them to your Application Dashboard. By using the custom Kusto query, it is possible to filter out any unwanted Failed Requests for your custom chart!
Tip: You do not need to write your query from scratch!
Go to Application Insights | Failures | View in Logs | Failed request count.
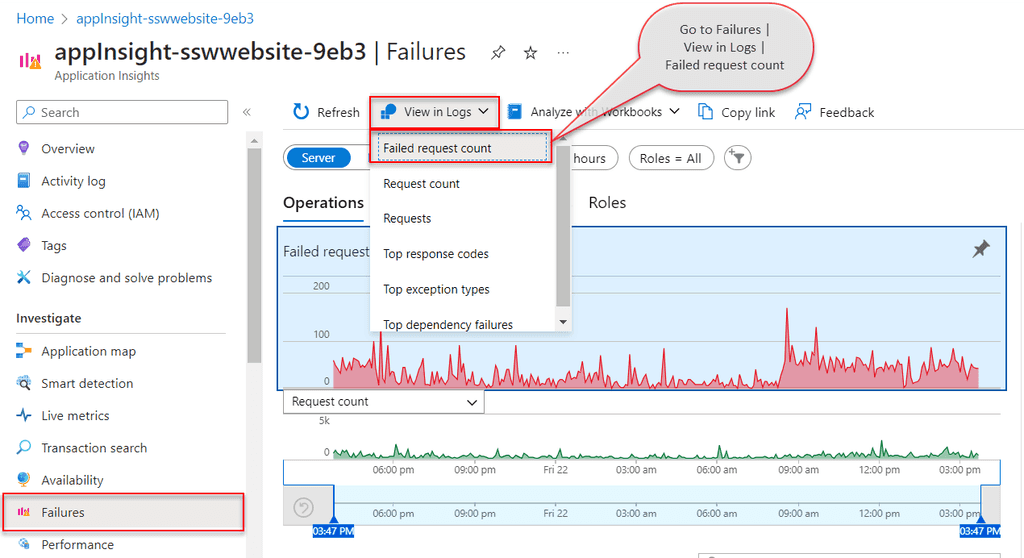
Figure: Access default Failed Requests query - Application Insights | Failures | View in Logs | Failed request count This will provide you with the default query, that you can customize and test in Azure Logs, before saving it in Workbooks.
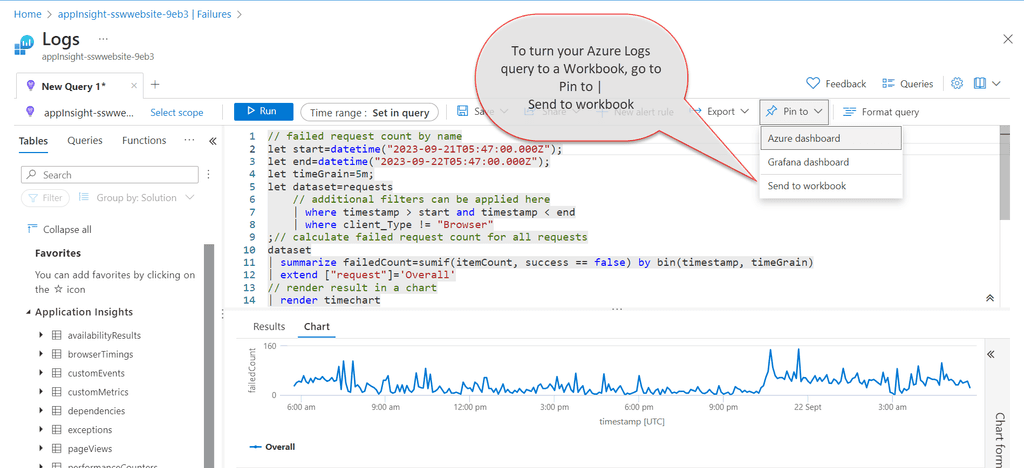
Figure: Save Azure Logs Query in Workbooks - Pin to | Send to workbook When your Workbook is ready and the custom query filters out any unwanted failed requests, you just need to pin its chart component to the Application Dashboard. If you click on the component from the Workbook, that is pinned to the Application Dashboard, it will take you inside the workbook. This way, you can use Workbook as a drill-down view for your pinned chart.
- Irrelevant – Failed Requests that you expect but cannot do anything about.
Azure Application Insights is your app's friendly doctor, keeping an eye on it to stay healthy and running smoothly. It uses an
Instrumentation Key(IK) to allow your app to send telemetry data to its resource.While this IK isn't a secret and is often included in client-side code, if it IK falls into the wrong hands, they could spam your telemetry or incur extra costs on ApplicationInsights.
The IK does not grant users access to read your data. In order for an application or a user to read your telemetry data, they need to authenticate into Application Insights with Entra ID (used to be Azure AD).
For client-side telemetry (e.g. Static Web Pages, Single Page Apps) the key will be visible in the browser via Dev Tools, but it is comforting to know that all the Application Insights telemetry is sent over HTTPS.
To prevent unintended access, Local authentication (via Instrumentation Key or API Keys) can be disabled for authenticating data ingestion. Once disabled, a stronger authentication method known as Role Based Access Control (RBAC) can be used.
With Role-Based Access Control (RBAC) we can define the specific applications and users that have the ability to send telemetry data, making unauthorized data injection harder.
This method also allows for more accurate Monitoring and Auditing because it allows us to log who accessed our resources and what actions they performed, which is crucial for security.
In summary, disabling local authentication and relying on Entra ID RBAC for telemetry ingestion in Azure Application Insights allows for more robust security measures, ensuring that only authorized entities can submit telemetry data.
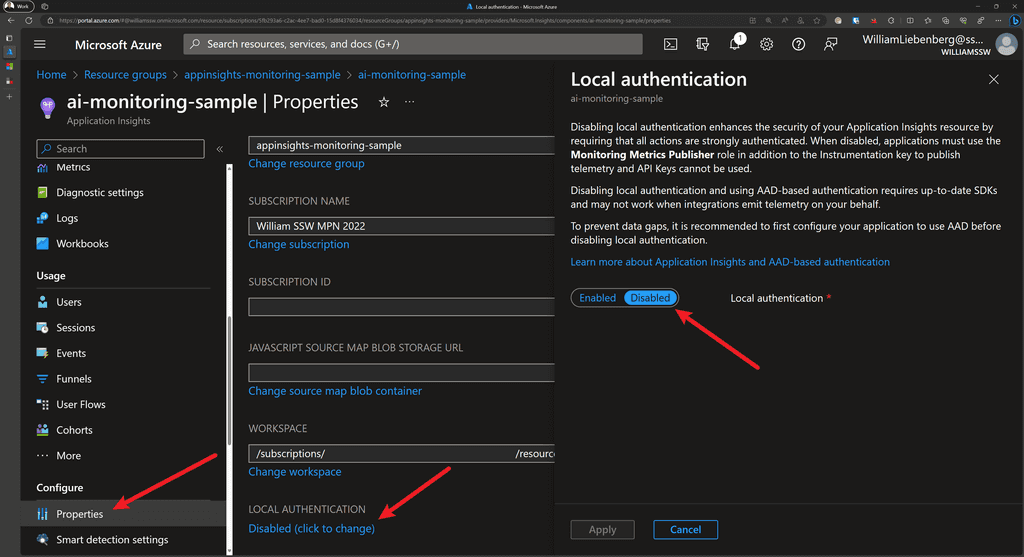
Increase Security - Disable Local Authentication Pros and Cons
Pros Cons ✅ No spam telemetry ❌ Does not work for Client-Side applications ✅ Perfect for Server-side applications ❌ Two Application Insights instances to collect Client and Server-side telemetry ✅ Accurate telemetry - Exact applications, servers, services are listed ❌ Custom Queries and Dashboards to combine Client and Server-side telemetry Securing Application Insights
In short, to secure the telemetry sent from your application to Application Insights, follow these steps:
- Use System-assigned or User-assigned Managed Identity with AppService
- Disable Local Authentication to enable RBAC
- Assign the
Monitoring Metrics Publisherrole to the AppService - Authenticate your application against AppInsights using a managed identity
Sample Application
Check out the sample ASP.NET Core application and Bicep code from William Liebenberg on GitHub
Add Managed Identity to AppService
To provision an Azure AppService with a System Assigned managed identity, add the following to your Bicep code:
resource appService 'Microsoft.Web/sites@2022-09-01' = {
  name: appServiceName
  location: location
  identity: {
    // ⬇️ add the code below for Azure to automatically assign a managed identity to the AppService
    type: 'SystemAssigned'
  }
  // ... the rest of your app service configuration
Figure: Enable System Assigned managed identity
Enable Role Based Access Control for Application Insights using Bicep
When provisioning your Application Insights resource using Bicep, you can enable RBAC by setting
DisableLocalAuthtotrue.resource appInsights 'Microsoft.Insights/components@2020-02-02' = { name: appInsightsName location: location kind: 'web' tags: tags properties: { Application_Type: 'web' Flow_Type: 'Bluefield' Request_Source: 'rest' WorkspaceResourceId: logAnalyticsWorkspace.id DisableLocalAuth: true // Enables RBAC } }Figure: Disable Local Authentication to enable Enhanced Security for Application Insights using Bicep
Disabling the local authentication enables RBAC which means that only users and applications with the
Monitoring Metrics Publisherrole and the appropriate instrumentation key will be able to track telemetry with this instance of Application Insights.Assigning Monitoring Metrics Publisher Role to AppService using Bicep
To give an Azure AppService the capability of sending telemetry to an Application Insights instance with RBAC enabled, the AppService must have the
Monitoring Metrics Publisherrole assigned to it.There are a couple of Azure quirks that make this less than trivial, but it is also not too complicated.
- Get the Role Definition using the Azure CLI:
az role definition list --name "Monitoring Metrics Publisher" --output json --query '[].{description:description, name:name, roleName:roleName}'Output:
[
  {
    "description": "Enables publishing metrics against Azure resources",
    "name": "3913510d-42f4-4e42-8a64-420c390055eb",
    "roleName": "Monitoring Metrics Publisher"
  }
]
The
namefield is aGUIDthat you use in the Bicep code to assign a role to an entity.- Add the following Bicep code to assign the
Monitoring Metrics Publisherrole to an Azure AppService:
// Get the existing Monitoring Metrics Publisher role definition
resource monitoringMetricsPublisherRoleDefinition 'Microsoft.Authorization/roleDefinitions@2022-04-01' existing = {
  scope: subscription()
  name: '3913510d-42f4-4e42-8a64-420c390055eb'
}

// Assign the Monitoring Metrics Publisher role to the AppService identity
resource monitoringMetricsPublisherRoleAssignment 'Microsoft.Authorization/roleAssignments@2022-04-01' = {
  name: guid(appInsights.id, appService.id, monitoringMetricsPublisherRoleDefinition.id)
  scope: appInsights
  properties: {
    principalType: 'ServicePrincipal'
    roleDefinitionId: monitoringMetricsPublisherRoleDefinition.id
    principalId: appService.identity.principalId
  }
}
Figure: Assigning Monitoring Metrics Publisher role to AppService Managed Identity using Bicep
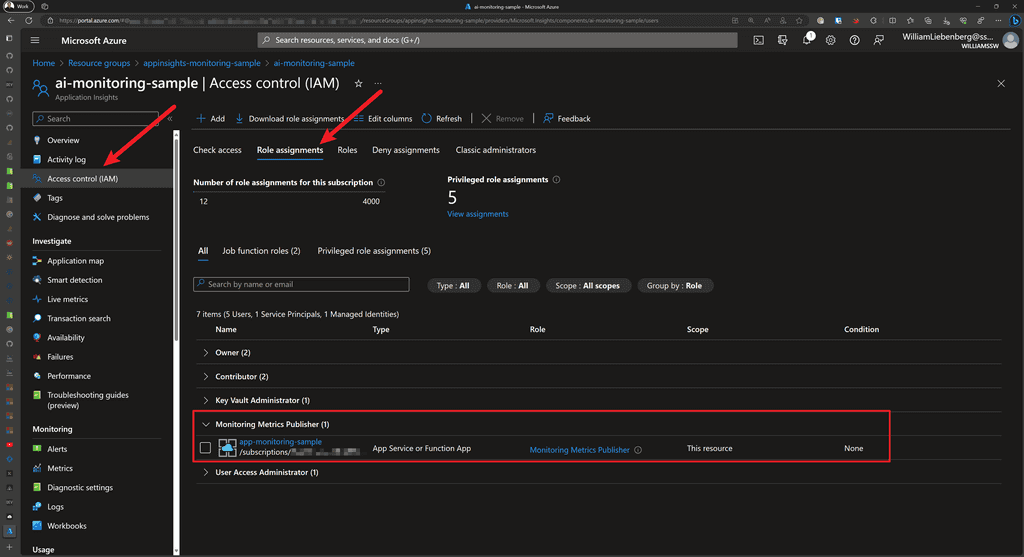
Figure: AppInsights shows the Monitoring Metrics Publisher role is assigned to AppService Authenticating with Application Insights
For ASP.NET Core applications running on Azure AppServices with the
Monitoring Metrics Publisherrole assigned, we can use a managed identity (System-assigned or User-assigned) to authenticate the application with a particular AppInsights instance.We accomplish this by using one of the following credential types:
DefaultAzureCredentialfor local development-
ManagedIdentityCredentialfor apps running in Azure with system-assigned or user-assigned managed identities- For system-assigned, use the default constructor without parameters.
- For user-assigned, provide the
client IDto the constructor.
Once the credential has been created, pass it to the Application Insights
TelemetryConfiguration:using AppService.AppInsights.Monitoring; using Azure.Identity; using Microsoft.ApplicationInsights; using Microsoft.ApplicationInsights.Extensibility; using Microsoft.AspNetCore.Mvc; var builder = WebApplication.CreateBuilder(args); // authenticate using Default (managed identity) Credentials for AppInsights builder.Services.Configure<TelemetryConfiguration>(config => { var credential = new ManagedIdentityCredential(); config.SetAzureTokenCredential(credential); }); // When using AppInsights and User Secrets for local development: // - Strange behavior: // When using the parameterless version of `.AddApplicationInsightsTelemetry()`, // the various Initializers and TelemetryClient do not receive the // `ApplicationInsights:ConnectionString` specified in `secrets.json` // // - Fix: Pass in `builder.Configuration` to `.AddApplicationInsightsTelemetry()` // // - Result: the Initializers and TelemetryClients are configured properly builder.Services.AddApplicationInsightsTelemetry(builder.Configuration); // ---- the rest of Program.cs ----Figure: Using Managed Identities when authenticating with Application Insights
Once the application starts up, authenticates with Application Insights, then you can start observing telemetry in the Application Insights resource or Application Dashboards.
Happy monitoring!
Application Insights can provide an overwhelming amount of errors in your web application, so use just-in-time bug processing to handle them.
The goal is to each morning check your web application's dashboard and find zero errors. However, what happens if there are multiple errors? Don't panic, follow this process to improve your application's health.
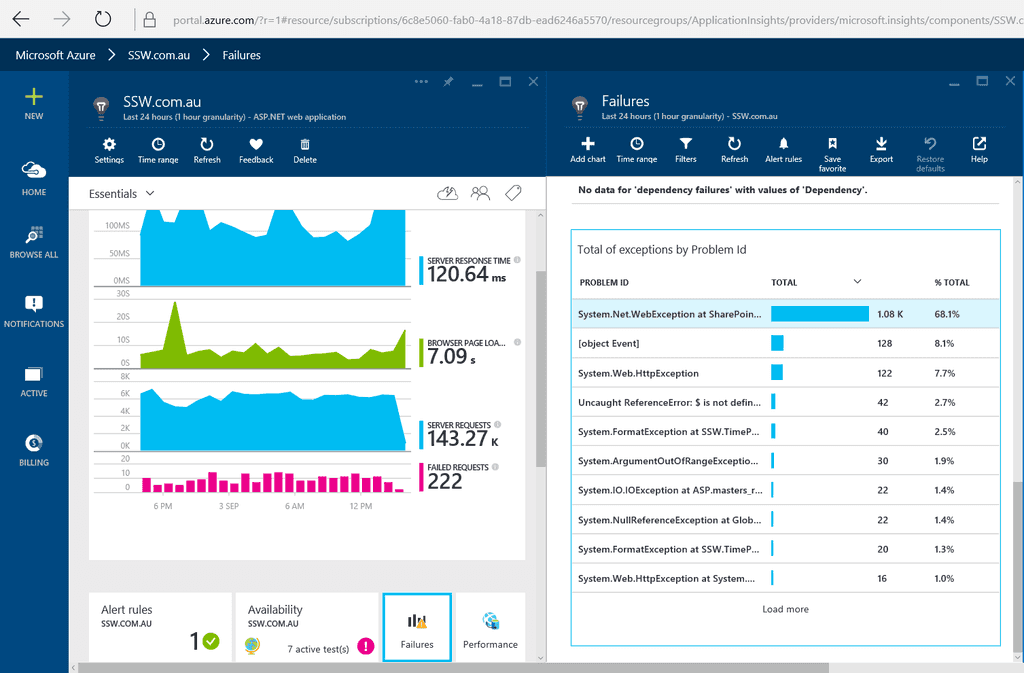
Figure: Every morning developers check Application Insights for errors Once you have found an exception you can drill down into it to discover more context around what was happening. You can find out the user's browser details, what page they tried to access, as well as the stack trace (Tip: make sure you follow the rule on How to set up Application Insights to enhance the stack trace).
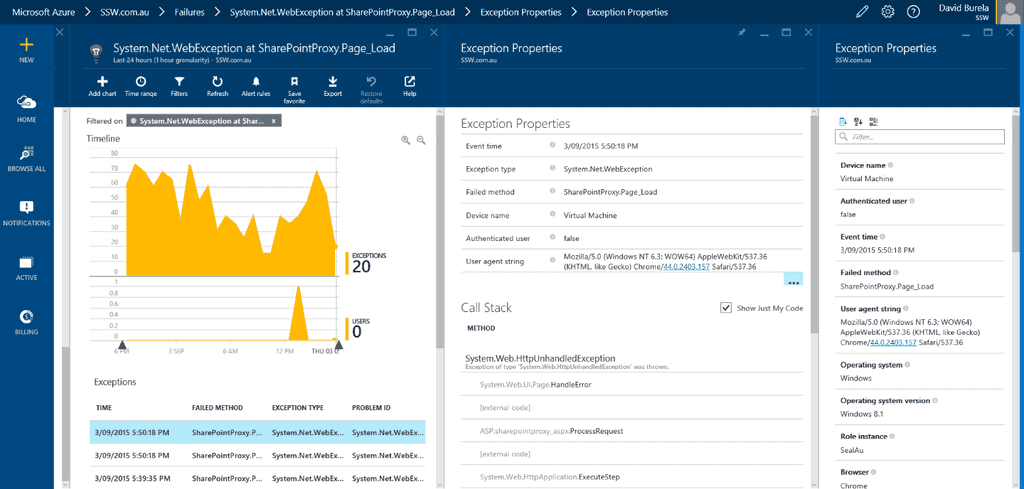
Figure: Drilling down into an exception to discover more. It's easy to be overwhelmed by all these issues, so don't create a bug for each issue or even the top 5 issues. Simply create one bug for the most critical issue. Reproduce, fix and close the bug then you can move onto the next one and repeat. This is just-in-time bug processing and will move your application towards better health one step at a time.
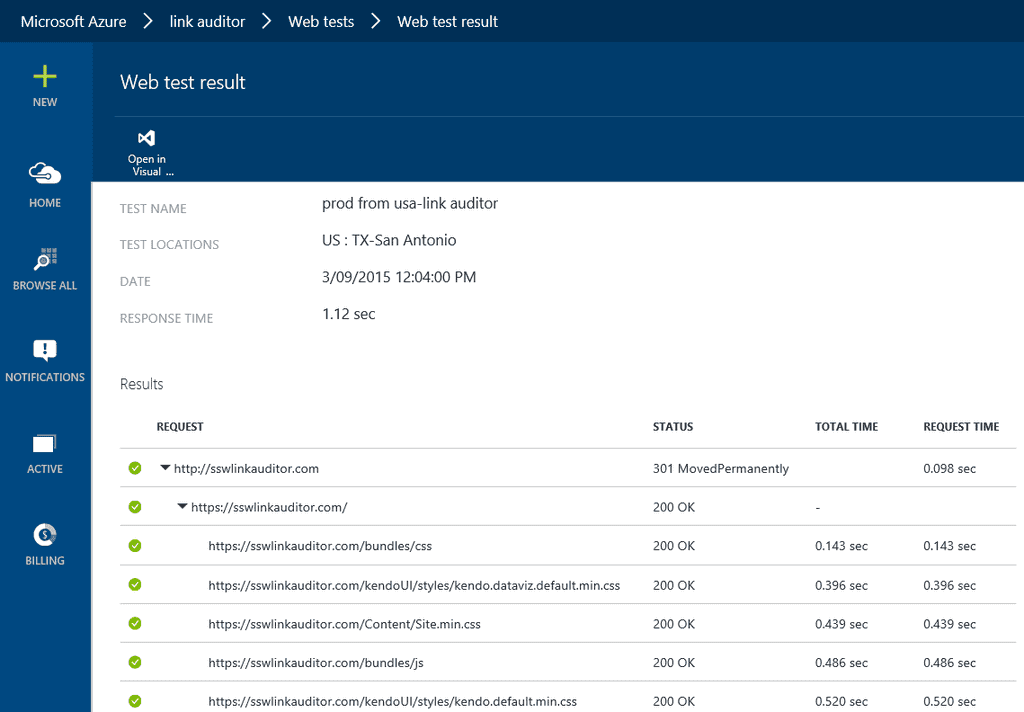
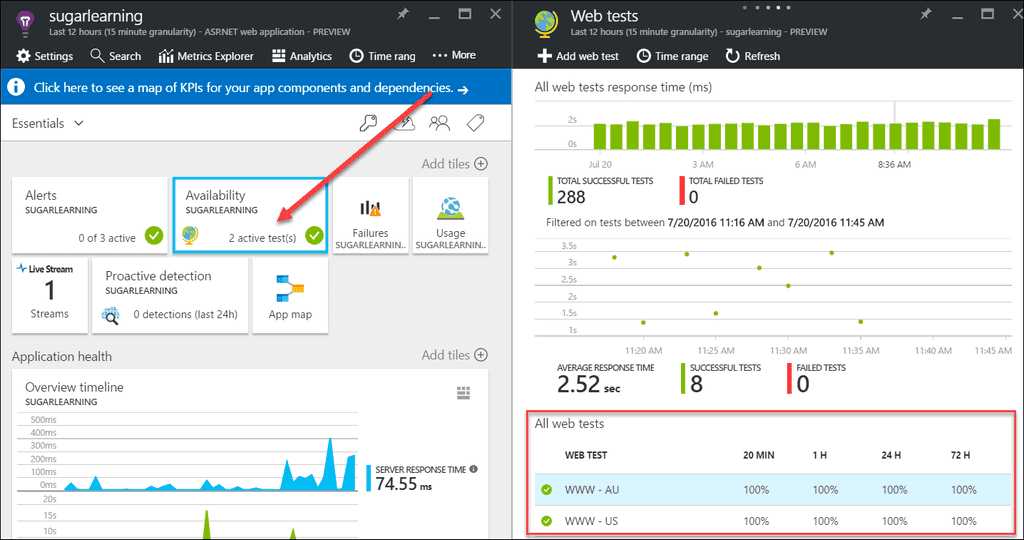
As soon as you have configured Application Insights, you should immediately add a Web Test to track general performance trends over time. You can configure test agents to access your application from different locations around the globe to give a general idea of what users will experience.
Instructions on how to add Web Tests can be found on [Microsoft Learn - Application Insights availability tests(https://learn.microsoft.com/en-us/azure/azure-monitor/app/availability?tabs=standard&WT.mc_id=AZ-MVP-33518).
Setting up a Web Test will allow you to query and see how the performance of your application has changed over a period of time and to help you spot any anomalies. It can be useful to query over a long period of time (e.g. a year) and see if the performance has stayed the same or if there have been any regressions in responsiveness.
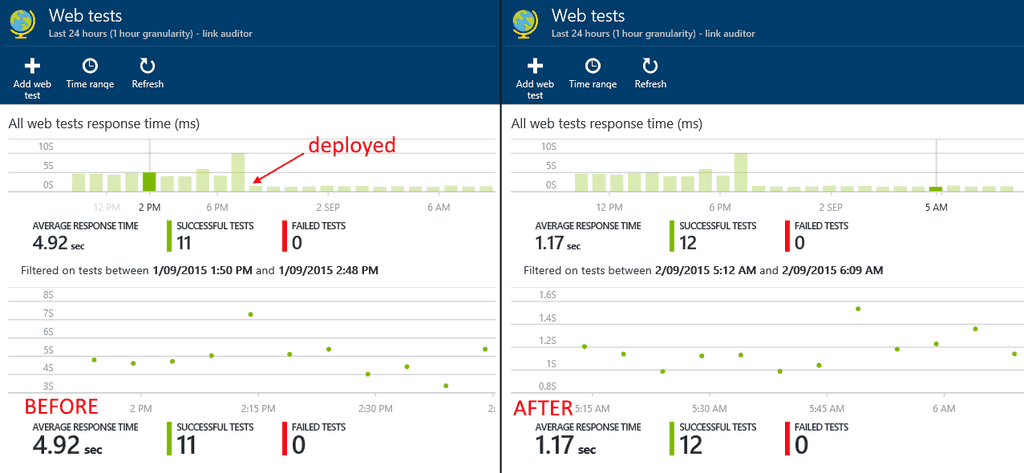
Good example - You can clearly see the point where a fix to production improved the initial page load You have the ability to drill down into web test results, to get an overview of the response time of the resources on a page. This can help discover if certain resources are slowing the response time.
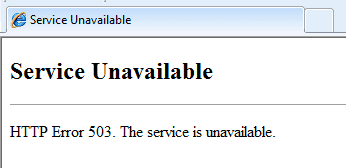
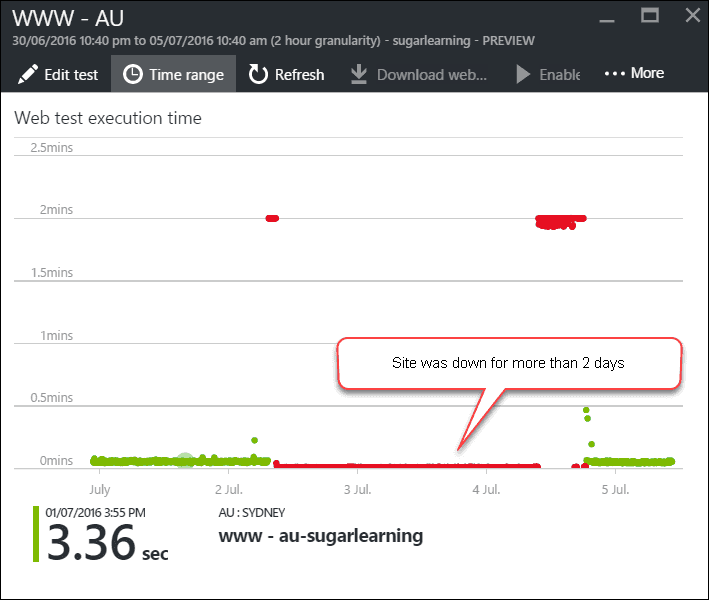
Nothing is worse than having your site down being unaware for a long period of time.
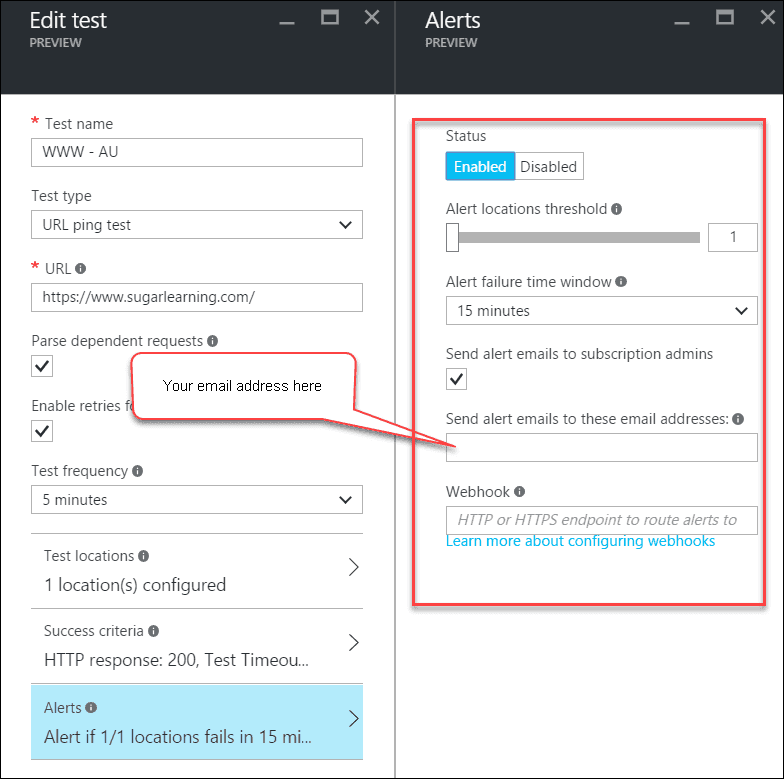
Application Insights can help you minimize the downtime by sending you an Email alert when your site becomes unavailable. You should create an availability test and enable the alert option as soon as your site goes live.
Bad example: Site was down over the weekend unnoticed
Good example: Availability tests are created for multiple locations
Good example: Email alert is enabled to minimize the downtime
Before starting any work, you should ensure developers take a look at your Application Insights data to make sure everything is performing correctly.
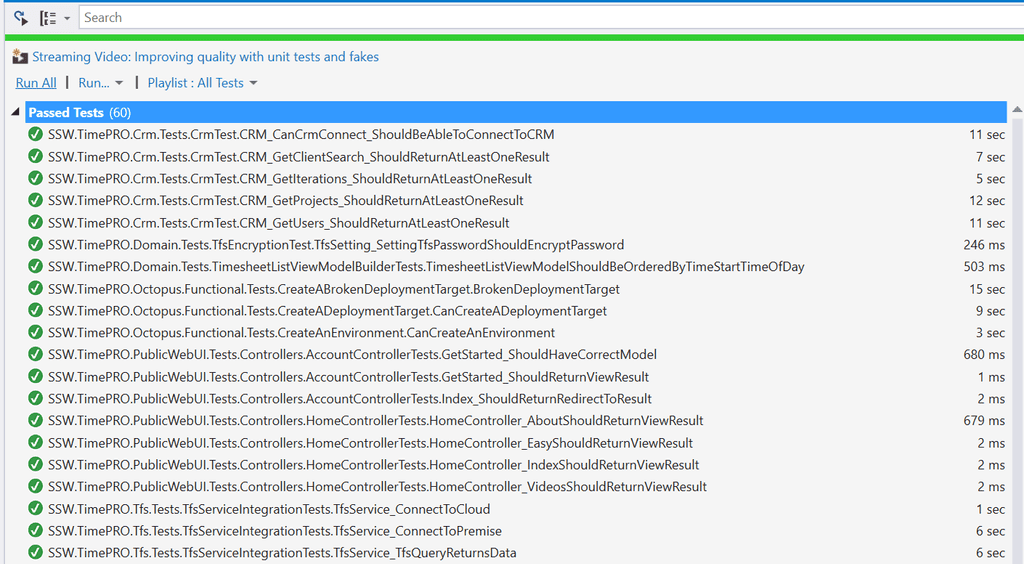
Most developers check only this first item before starting their work:
- Check Unit Tests are Green
Figure: Tests are green. I'm ready to start work... or am I?
More advanced teams check their application insights data as well. This includes:
- Look for any new Unhandled Exceptions
See Do you know the daily process to improve the health of your web application?
Figure: Unhandled Exceptions - Is there anything you don't know about here?
- Look for any obvious performance issues (Server then client).
See Do you know how to find performance problems with Application Insights?
Figure: Performance - The Server Responses tab shows the slowest running pages.
You've set up your Application Insights as per the rule 'Do you know how to set up Application Insights.
Your daily failed requests are down to zero & You've tightened up any major performance problems.
Now you will discover that understanding your users' usage within your app is child's play.
The Application Insights provides devs with two different levels of usage tracking. The first is provided out of the box, made up of the user, session, and page view data. However, it is more useful to set up custom telemetry, which enables you to track users effectively as they move through your app.
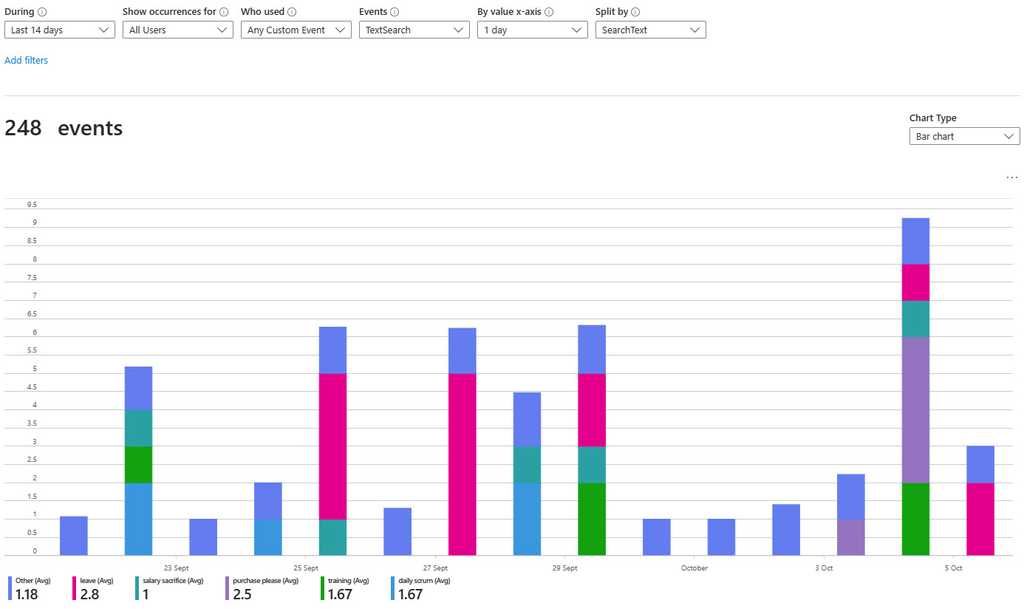
Figure: Easily track and compare custom events It is very straightforward to add these to an application by adding a few lines of code to the hot points of your app. Follow Application Insights API for custom events and metrics to learn more.
If you feel constricted by the Application Insights custom events blade? Then you can export your data and display it in PowerBI, take a look at Using Azure Log Analytics in Power BI
Once you have set up your Application Insights as per the rule 'Do you know how to set up Application Insights' and you have your daily failed requests down to zero, you can start looking for performance problems. You will discover that uncovering your performance related problems are relatively straightforward.
The main focus of the first blade is the 'Overview timeline' chart, which gives you a birds eye view of the health of your application.
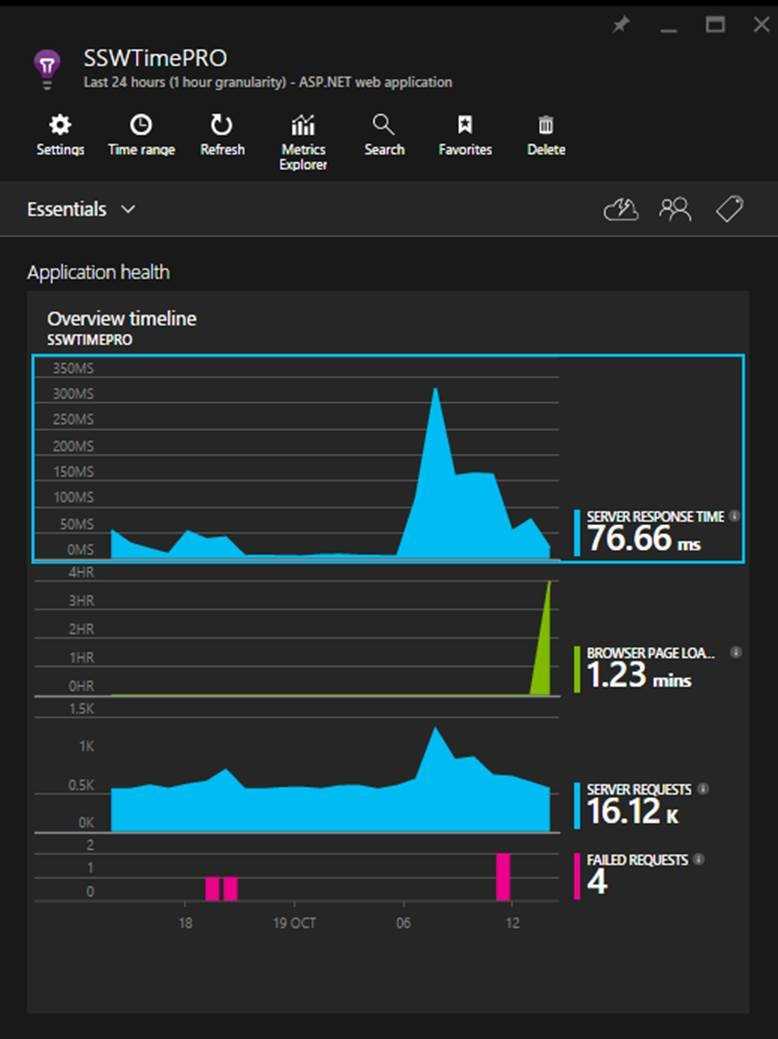
Figure: There are 3 spikes to investigate (one on each graph), but which is the most important? Hint: look at the scales! Developers can see the following insights:
- Number of requests to the server and how many have failed (First blue graph)
- The breakdown of your page load times (Green Graph)
- How the application is scaling under different load types over a given period
- When your key usage peaks occur
Always investigate the spikes first, notice how the two blue ones line up? That should be investigated, however, notice that the green peak is actually at 4 hours. This is definitely the first thing we'll look at.
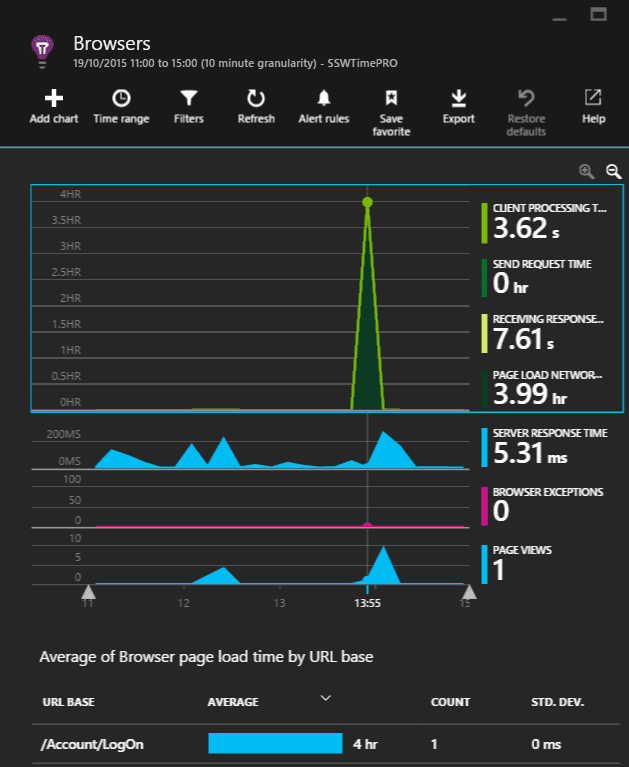
Figure: The 'Average of Browser page load time by URL base' graph will highlight the slowest page. As we can see that a single request took four hours in the 'Average of Browser page load time by URL base' graph, it is important to examine this request.
It would be nice to see the prior week for comparison, however, we're unable to in this section.
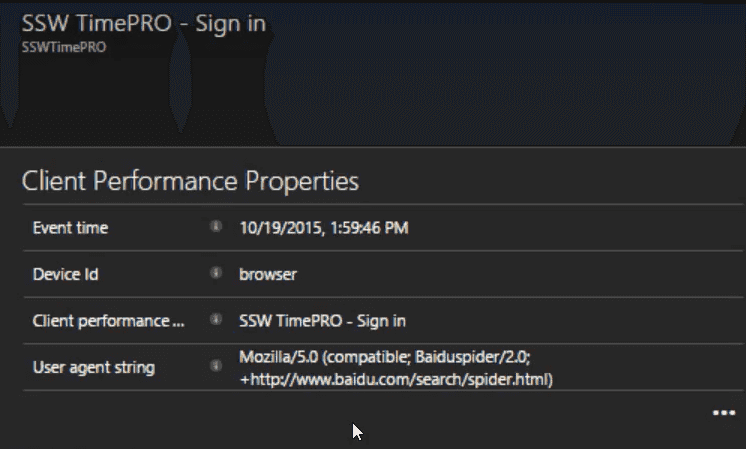
Figure: In this case, the user agent string gives away the cause, Baidu (a Chinese search engine) got stuck and failed to index the page. At this point, we'll create a PBI to investigate the problem and fix it.
(Suggestion to Microsoft, please allow annotating the graph to say we've investigated the spike)
The other spike which requires investigation is in the server response times. To investigate it, click on the blue spike. This will open the Server response blade that allows you to compare the current server performance metrics to the previous weeks.
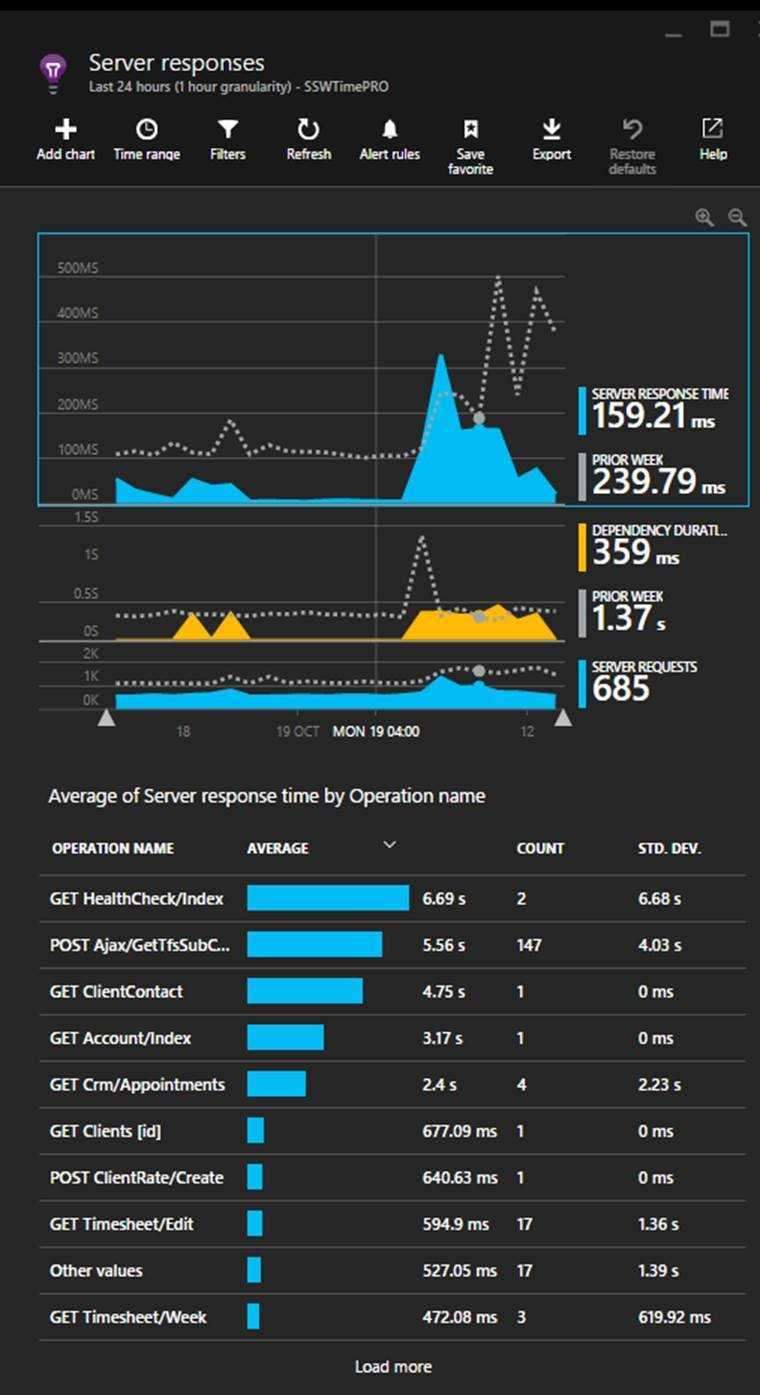
Figure: In this case, the most important detail to action is the Get Healthcheck issue. Now you should be able to optimise the slowest pages In this view, we find performance related issues when the usage graph shows similarities to the previous week but the response times are higher. When this occurs, click and drag on the timeline to select the spike and then click the magnifying glass to ‘zoom in’. This will reload the ‘Average of Server response time by Operation name’ graph with only data for the selected period.
Looking beyond the Average Response Times
High average response times are easy to find and indicate an endpoint that is usually slow - so this is a good metric to start with. But sometimes a low average value can contain many successful fast requests hiding a few much slower requests.
Application insights plots out the distribution of response time values allowing potential issues to be spotted.
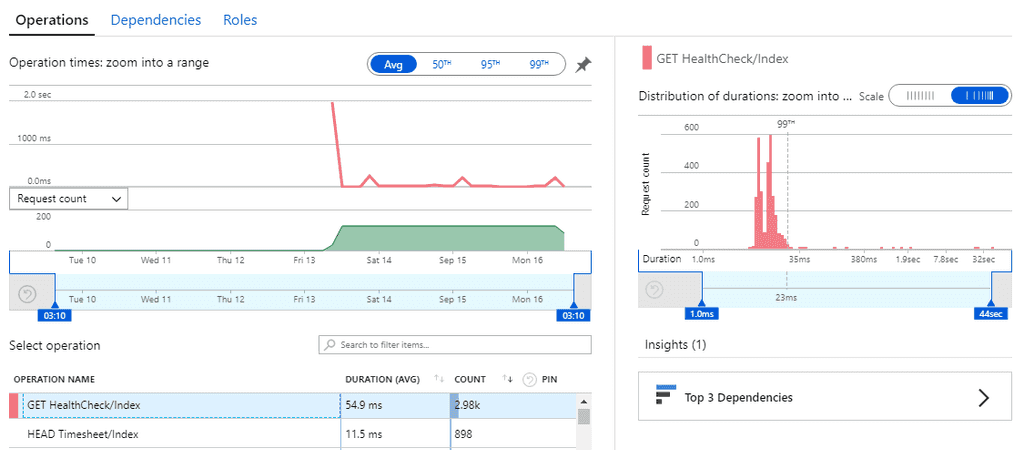 **Figure: this distribution graph shows that under an average value of 54.9ms, 99% of requests were under 23ms but there were a few requests taking up to 32 seconds!
**
**Figure: this distribution graph shows that under an average value of 54.9ms, 99% of requests were under 23ms but there were a few requests taking up to 32 seconds!
**In the Face of Armageddon
When there's a major error during deployment or a catastrophic fault happens, what is your first instinct? Is it to hit that Roll Back button?
It feels like reverting back to the previous stable version is the safest and quickest way to restore functionality.

Figure: Fixing Problems However, rolling back can have several negative consequences, making it crucial to consider the drawbacks:
- Negation of new features and improvements
- Cycle of constant reversion
- Resource-intensive and disruptive
- Causes downtime and requires manual intervention
From Setback to Comeback
To support making decisions, developers should set up robust monitoring systems. Effective monitoring ensures accurate and prompt issue identification, aiding informed decision-making. This is particularly important when it comes making the decision to Roll Forward.
Here are the reasons why you should Roll Forward:
- Continuous Improvement: Rolling forward allows for incremental improvements, ensuring that any issues are promptly addressed without hindering overall progress.
- Minimized Downtime: By fixing issues on the go rather than reverting to previous versions, Rolling Forward reduces system downtime and minimizes disruptions to business operations.
- Data Integrity: Changes that minimally impact user data or schema allow for seamless updates without risking data integrity. Rolling Forward ensures that data remains intact and consistent.
- Customer Confidence: Demonstrating a commitment to Rolling Forward and resolving issues promptly can build customer confidence and trust in your ability to deliver reliable and up-to-date solutions.
By prioritizing rolling forward, you embrace a proactive approach that promotes resilience, agility, and continuous delivery.
Prevention is Better Than Cure
To keep your deployments stress free, do the following:
- Set up Application Insights
- Write Unit Tests
- Understand the different types of testing
- Set up a production-like environment
- Manage Feature Flags
If issues occur, rolling forward with targeted fixes is the best way to maintain progress and stability.
