Rules to Better Application Performance - 20 Rules
Optimize your application’s efficiency with these essential performance guidelines. This collection covers performance testing, metrics analysis, and strategies for identifying and resolving bottlenecks to ensure your application runs smoothly and effectively.
Performance, load and stress testing should be tackled after you have confirmed that everything works functionally (usually after UX testing). Performance testing should only be after daily errors are down to zero (reported by Application Insights or Raygun). This way you can be sure that any functional issues that occur during performance tests are scaling issues.
Optimizing bundle size improves website performance, reduces load times, and enhances user experience. Large bundles slow rendering, increase memory usage, and hurt SEO. By minimizing dependencies, using tree shaking, code splitting, and dynamic imports, developers ensure only necessary code loads. This leads to faster interactions, lower bandwidth use, and better mobile performance, making optimization essential for a smooth web experience.
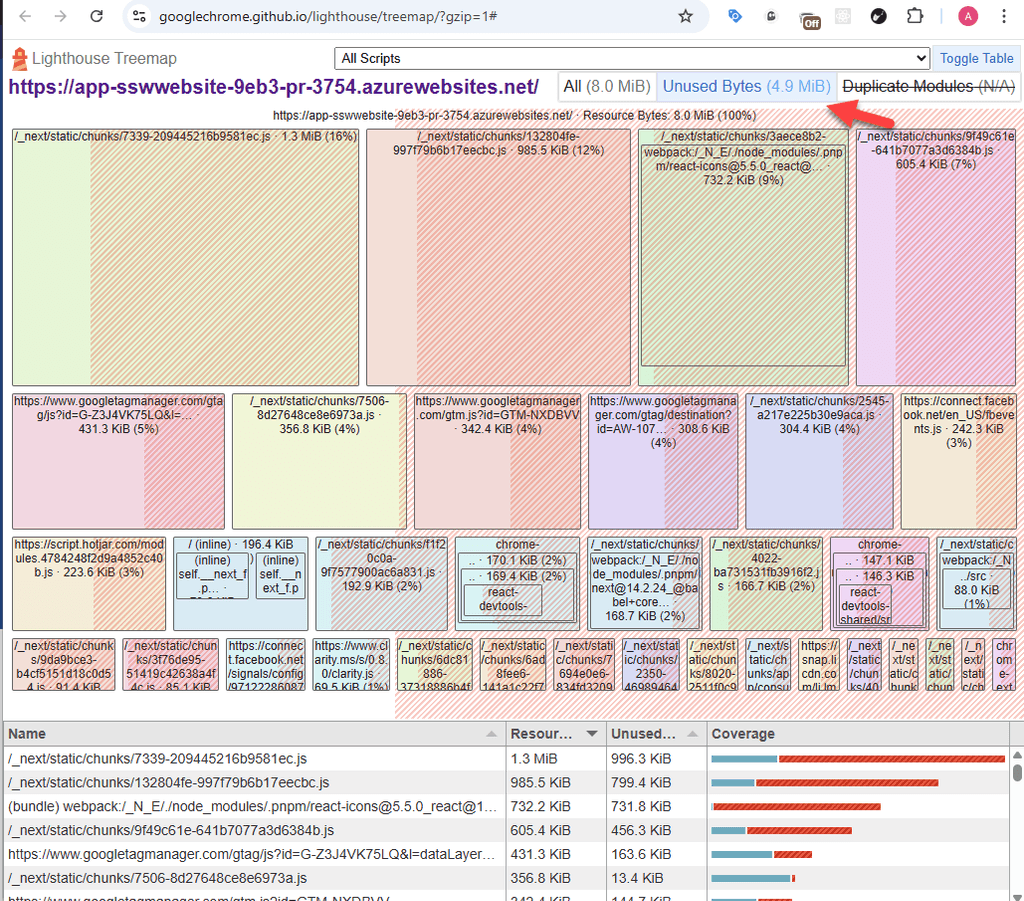
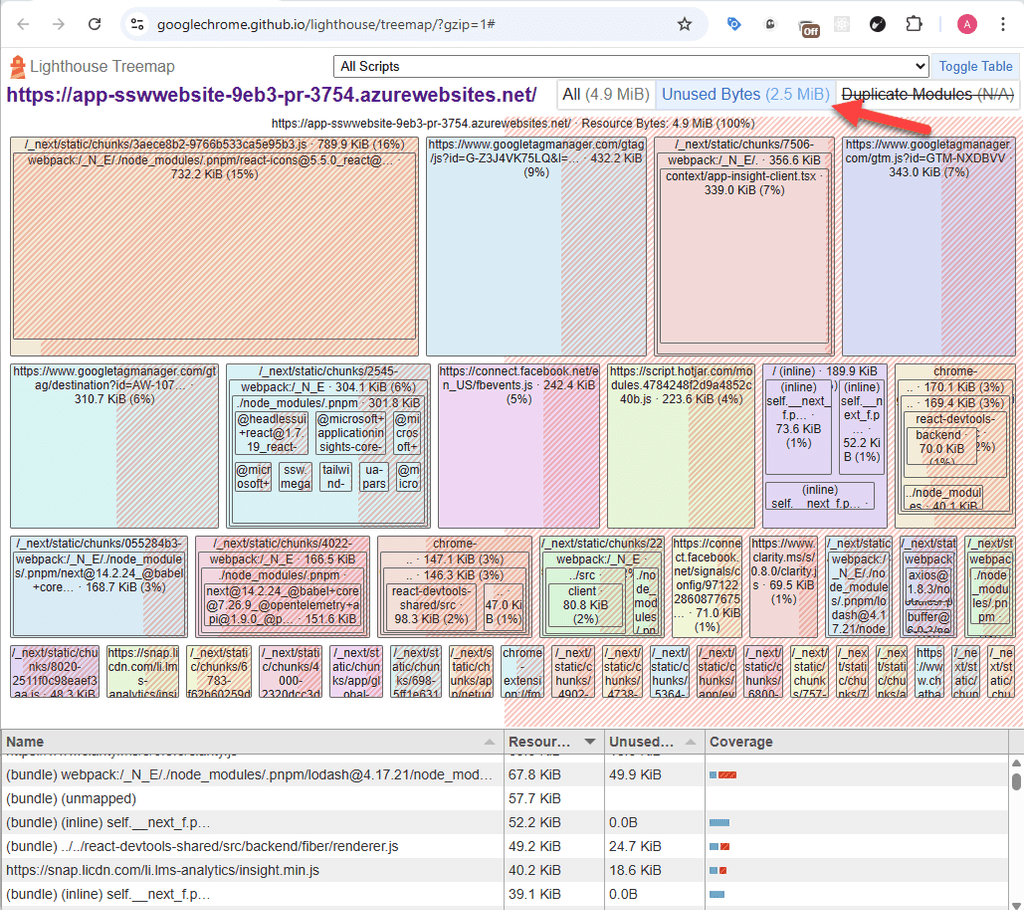
Checking the Lighthouse Treemap for bundle size
It's important to analyze the unused JavaScript in the final bundles. Lighthouse Treemap is a powerful tool to visually inspect your bundles and identify unused or unnecessary code that might be bloating your project. By checking the Lighthouse Treemap, you can identify potential issues with your code.
Find out the First Load JS Sizes for Routes
When creating static pages with dynamic content, the JavaScript size can increase as more scripts are bundled together. Monitoring the initial load JS allows you to identify these increases and optimize accordingly. Tracking this during the build process helps to pinpoint potential route causes to address.
Route (app)                     Size        First Load JS
┌ ○ /                           2.11 kB     1.31 MB
├ ○ /_not-found                 145 B       89.8 kB
├ ● /[filename]                 7.59 kB     1.32 MB
├ ├ /advertising
├ ├ /anti-slavery-policy
├ ├ /booknow
├ └ [+10 more paths]
Bash: Bad example - The initial JavaScript load size is quite huge and it is in the megabytes
Use Bundle Analyzers to identify Bundle sizes by each module
A bundle analyzer can help you visualize your JavaScript bundle, understand which modules are taking up space, and find opportunities for optimization. By using these tools, you can reduce bundle size, improve load times, and enhance your site's performance.
Bundle Analyzers for JavaScript
1. Webpack Bundle Analyzer (Recommended)
- Description: Visualizes the size of each module in a Webpack bundle, helping identify large or unnecessary files.
- Link: Webpack Bundle Analyzer
2. Next.js Bundle Analyzer (Recommended for Next.js Projects)
Description: A specific analyzer for Next.js that shows how different parts of your app contribute to the bundle size.
Setup:
- Install the analyzer:
npm install @next/bundle-analyzer- Add this configuration to your
next.config.js:
const withBundleAnalyzer = require('@next/bundle-analyzer')({ enabled: process.env.ANALYZE === 'true', }); module.exports = withBundleAnalyzer({ // other Next.js config options });- Then run the analyzer with:
ANALYZE=true next buildLink: Next.js Bundle Analyzer
3. Source Map Explorer
- Description: Analyzes source maps to visualize the size and contribution of individual files in your bundle.
- Link: Source Map Explorer
Optimizing Imports for Better Tree Shaking
How importing only what you need can reduce bundle size and improve performance.
// Importing the entire utility module, even if only one function is needed
import * as utils from './utils';

const result = utils.expensiveFunction();
Code: Bad example - Importing entire module
// Importing only the required function
import { expensiveFunction } from './utils';

const result = expensiveFunction();
Code: Good example - Importing only the required function
Optimize Bundle Size with Dynamic Imports and Suspense
Using dynamic imports and React Suspense helps reduce your JavaScript bundle size by loading code only when needed. This improves performance by splitting your code and reducing initial loading times.
Dynamic Imports
Dynamic imports allow you to load modules on demand, only when they're required. This avoids loading unnecessary code during the initial load.
// Without dynamic import
import { MyComponent } from './MyComponent';

// With dynamic import
const MyComponent = React.lazy(() => import('./MyComponent'));
React Suspense
React Suspense works with React.lazy() to delay the rendering of components until they are loaded. It helps avoid blocking the UI and improves user experience.
import React, { Suspense } from 'react';

// Lazy-loaded component
const MyComponent = React.lazy(() => import('./MyComponent'));

function App() {
  return (
    <Suspense fallback={<div>Loading...</div>}>
      <MyComponent />
    </Suspense>
  );
}
By optimizing imports as outlined above, you can significantly reduce the First Load JavaScript size.
Optimized Initial JavaScript Load
Route (app)                     Size        First Load JS
┌ ○ /                           2.11 kB     315 kB
├ ○ /_not-found                 145 B       89.8 kB
├ ● /[filename]                 7.59 kB     321 kB
├ ├ /advertising
├ ├ /anti-slavery-policy
├ ├ /booknow
├ └ [+10 more paths]
Bash: Good example - The First Load JavaScript size is reduced to kilobytes from megabytes.
Lighthouse Treemap
Monitor bundle size using Lighthouse on PR links
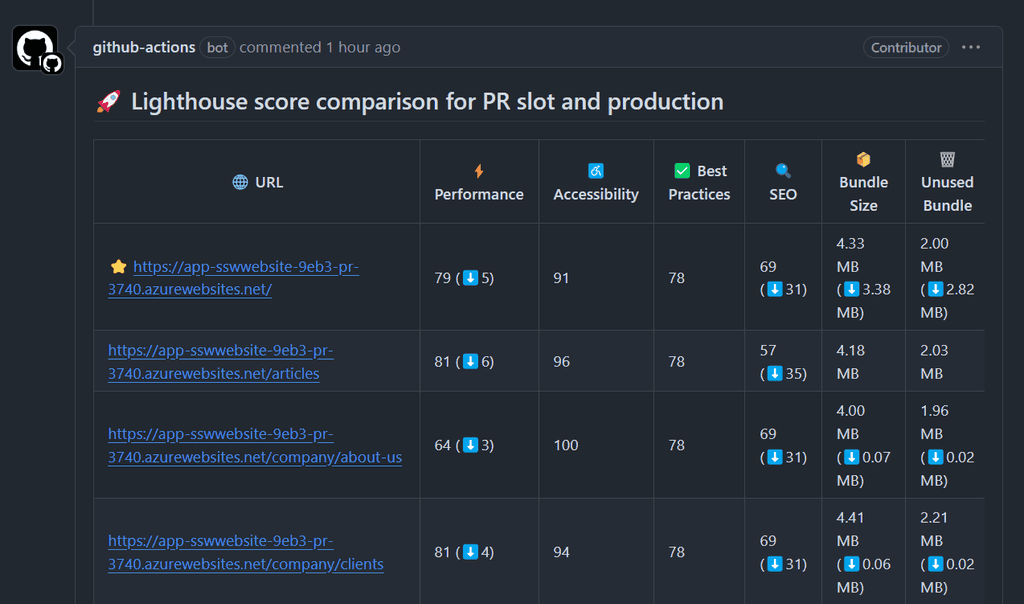
During development, it's easy to unintentionally introduce additional bundles with your PR. To track and monitor bundle sizes and performance for each Pull Request (PR), run Lighthouse audits on deployed preview links. This ensures bundle optimizations are maintained and prevents performance regressions.
The following table shows Lighthouse reports for various PR links, including Performance, Accessibility, Best Practices, SEO, Bundle Size, and Unused Bundle Size.
Example PR Check Results
🌐 URL ⚡ Performance ♿ Accessibility ✅ Best Practices 🔍 SEO 📦 Bundle Size 🗑️ Unused Bundle ⭐ PR Main Page 82 91 74 69 4.59 MB 2.11 MB Articles 82 96 74 57 4.39 MB 2.54 MB About Us 83 100 74 69 4.30 MB 1.97 MB Clients 64 94 74 69 4.68 MB 2.51 MB Contact Us 65 90 74 61 4.61 MB 2.74 MB Consulting 78 90 70 69 4.59 MB 2.70 MB ⭐ Net Upgrade 62 90 56 54 4.59 MB 2.70 MB ⭐ Web Applications 75 98 74 61 4.57 MB 2.65 MB ✅ Benefits of PR Lighthouse Checks
- Automated Performance Monitoring: Automatically monitor performance and bundle size on every PR
- Track Bundle Size Trends: Identify if a new change increases the bundle size or if performance decreases
- Enforce Performance Standards: Set performance goals (e.g., bundle size under a certain limit) and enforce them across all PRs
Nobody Likes a Slow Website. You should optimize the performance of your websites so it loads as quick as possible.
You should use Pingdom Website Speed Test to analyze the load speed of your websites and learn how to make them faster.
Then work to keep it under 3 MB:
Rating Page Size ❌ Unacceptable > 3 MB 👍 OK 1.5 MB to 3 MB (apple.com is 1.5 MB) ✅ Good < 1.5 MB ⭐️ Excellent < 1 MB Before merging any Pull Request (PR) that might affect your application's behavior or performance, you should run comparison tests between the production environment and the PR deployment slot to identify potential issues.
Why compare PR performance with Production?
It is essential to compare PR performance against the production environment. This ensures that new changes do not introduce performance drops that can negatively impact user experience, SEO rankings, or best practices.
Modern web applications are dynamic, with frequent updates to code, styles, and assets. Even minor changes can lead to increased load times, larger bundle sizes, or degraded accessibility. By integrating automated performance checks into your CI/CD pipeline, you can catch issues early and maintain high application quality.
How to compare PR performance with Production?
One of the best ways to measure performance is by using Lighthouse, a widely used tool for analyzing key web performance metrics such as:
- Performance (e.g., page load speed, rendering time)
- Accessibility (ensuring usability for all users)
- Best Practices (security, coding standards)
- SEO (ensuring search engines can properly index the site)
- Bundle Size & Unused Code (optimizing assets for faster loading)
Automating Lighthouse Comparison in PRs
You can integrate Lighthouse into your GitHub Actions workflow using Lighthouse CI Action. This enables automated comparison of the PR deployment with the current Production site. A summary comment can be added to the PR, showing key performance differences.
By following this approach, teams can ensure that new code changes do not negatively impact performance. The comparison table allows developers to quickly identify performance drops and take action before merging, leading to a more consistent and reliable user experience.
When starting on the path of improving application performance, it is always important to know when you can stop. The goal posts would depend on the type of application being written and the number of active users of the application and the budget. Some examples of performance goals are:
Example 1: High performance website
- Every page refresh is under 500ms
- Able to handle 1000 active concurrent users
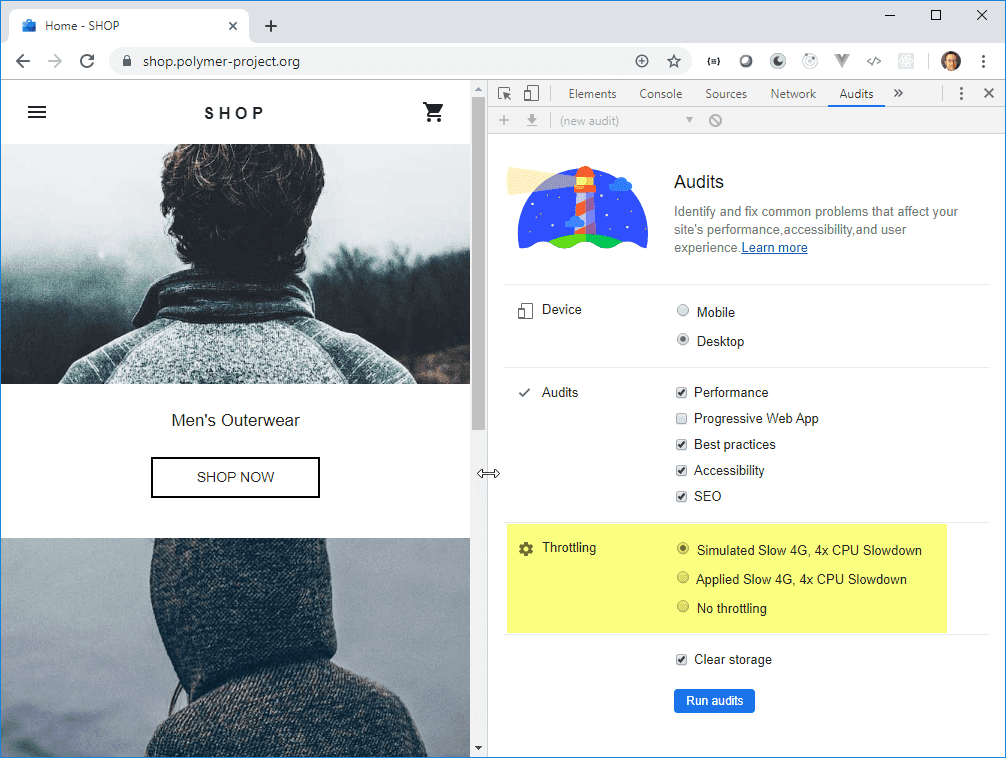
- Getting at least a score of 80 for Performance on Google Lighthouse - with throttling turned on
Example 2: Office Intranet Application
- Every page referesh is under 2 seconds
- Able to handle 50 active concurrent users
- Getting at least a score of 95 for Performance on Google Lighthouse - with throttling turned off.
With the goal posts firmly in sight, the developers can begin performance tuning the application.
In every successful team or project, it is crucial to track meaningful progress rather than relying solely on gut feelings. Clear metrics transform vague opinions into data-driven insights. This approach leads to better decisions, more objective performance reviews, and continuous improvement over time.
When a client raises concerns about performance, it is important not to immediately dive into the code to make blind fixes. Instead of guessing what might help, we should approach the issue methodically by starting with clear benchmarks, profiling, and data-driven decisions.
For example, if a client says:
"This application is too slow, I don't really want to put up with such poor performance. Please fix."
We don't jump in and look at the code and clean it up and reply with something like:
"I've looked at the code and cleaned it up. Please tell me if you are OK with the performance now."
A better way is:
- Ask the client to tell us how slow it is (in seconds) and how fast they ideally would like it (in seconds)
- Add some code to record the time the function takes to run
- Reproduce the steps and record the time
- Change the code
- Reproduce the steps and record the time again
- Reply with metrics. E.g. "It was 22 seconds, you asked for around 10 seconds. It is now 8 seconds."
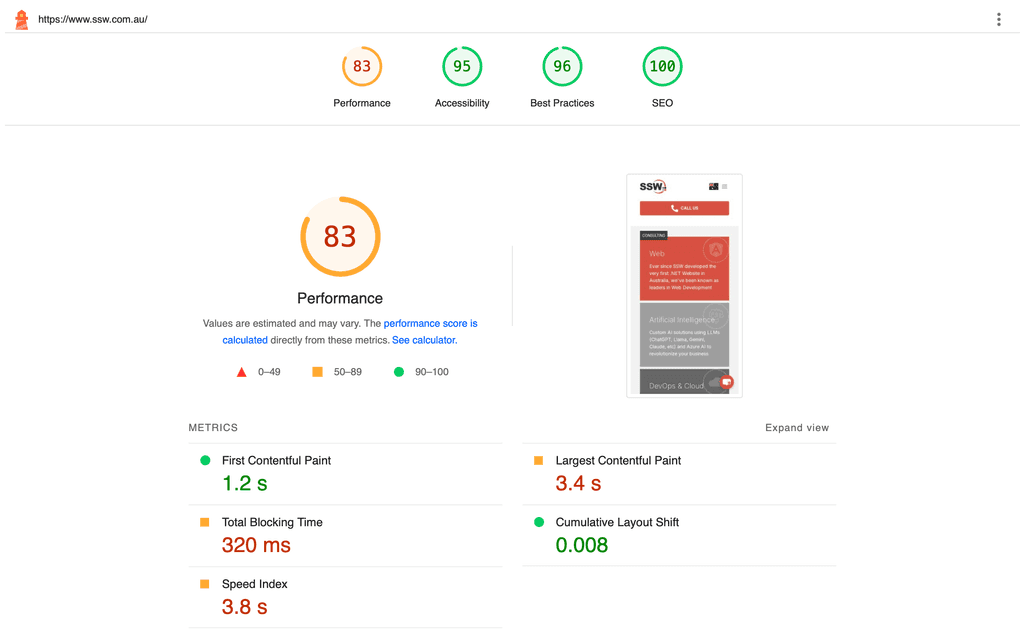
Figure: Good example – Use metrics to check the timing, before fixing any performance issues (An example from SSW CodeAuditor) Also, never forget to do incremental changes in your tests!
For example, if you are trying to measure the optimal number of processors for a server, do not go from 1 processor to 4 processors at once:
Do it incrementally, adding 1 processor each time, measuring the results, and then adding more:

Figure: Good example - Going from 1 to 2, then measuring, then incrementally adding one more, measuring... This gives you the most complete set of data to work from.
This is because performance is an emotional thing, sometimes it just *feels* slower. Without numbers, a person cannot really know for sure whether something has become quicker. By making the changes incrementally, you can be assured that there aren’t bad changes canceling out the effect of good changes.
Measuring Performance
Depending on your tech stack, there are various tools available to measure performance. For frontends, Google Chrome's DevTools provides a performance measurement tool.
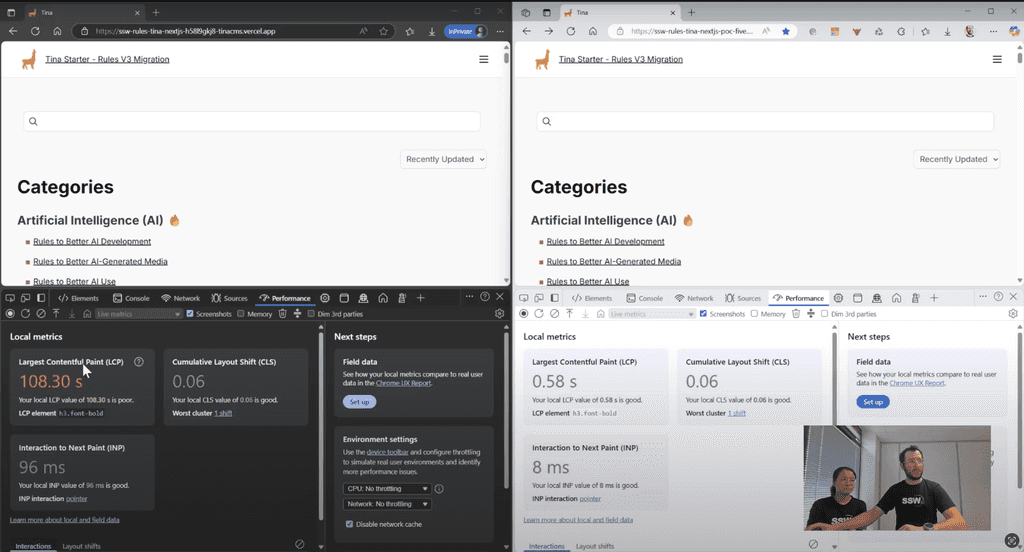
Figure: Google Chrome has a handy Performance tab in the DevTools 
Figure: Pingdom has advanced tools for diagnosing page performance issue Here are other performance tools worth considering:
Frontend Performance
- Page Speed Insights - Google's web performance analyzer
- React Developer Tools - Component-specific profiling for React apps
- Pingdom - Offers uptime monitoring, page performance analysis & drilling for advanced performance troubleshooting
API Performance
- Insomnia - REST client with performance timing
- BenchmarkDotNet - .NET microbenchmarking framework
- Fiddler - HTTP debugging proxy with performance metrics
- Visual Studio Performance Profiler - Integrated .NET profiling
- Bombardier - HTTP load testing tool
Telemetry & monitoring
- Azure App Insights - Microsoft's application performance monitoring
- OpenTelemetry - Vendor-neutral observability framework
- Sentry.io - Error tracking with performance monitoring
- AWS CloudWatch - Amazon's monitoring and observability service
Samples
For sample code on how to measure performance, please refer to Do you have tests for Performance? on Rules To Better Unit Tests.
The following steps will help to guide efforts to implement a performance improvement. The key is to only make a small change with each iteration and run a performance test to ensure that change resulted in an improvement.
- Establish a performance target (goal posts)
- Build an automated performance test
- Run the performance test to establish a baseline (the current performance data)
- Make one change to the process
- Run the performance test again to measure the impact of the single improvement against the baseline
- If the change results in a measurable performance improvement, then keep it
- Repeat steps 4 to 6 until the performance target has been met
For bonus points when you're ready to deploy to production:
- Run the performance test against production to establish a production baseline
- Deploy the changes to production
- Run the performance test to measure the impact of the improvements
- Provide the performance improvement results to your Product Owner and bask in the shower of compliments coming your way for a job well done!
Working against a baseline and having a defined target will ensure that you are not prematurely or over optimizing your process.
Lighthouse is an open-source tool built into Google Chrome that can audit for performance, accessibility, progressive web apps, and more. Allowing you to improve the quality of web pages.
You can run Lighthouse:
- In Chrome DevTools
- From the command line
- As a Node module
It runs a series of audits against a URL and then it generates a report on how well the page did. From there, you can use the failing audits as indicators on how to improve the page. Each audit has a reference doc explaining why the audit is important, as well as how to fix it.
Lighthouse Level 1: Throttling Off
For applications intended for use on a desktop and from within a well-connected office (such as your intranet or office timesheet application) test with throttling turned off.
Lighthouse Level 2: Throttling On
To see how well your website would perform on low-spec devices and with poor internet bandwidth, use the throttling features. This is most important for high volume, customer-facing apps.
Lighthouse Level 3: Automated testing
For business-critical pages, you may want to automate Lighthouse testing as part of your Continuous Delivery pipeline. This blog post by Andrejs Abrickis shows how to configure an Azure DevOps build pipeline that performs Lighthouse testing.
For modern applications, there are many layers and moving parts that need to seamlessly work together to deliver our application to the end user.
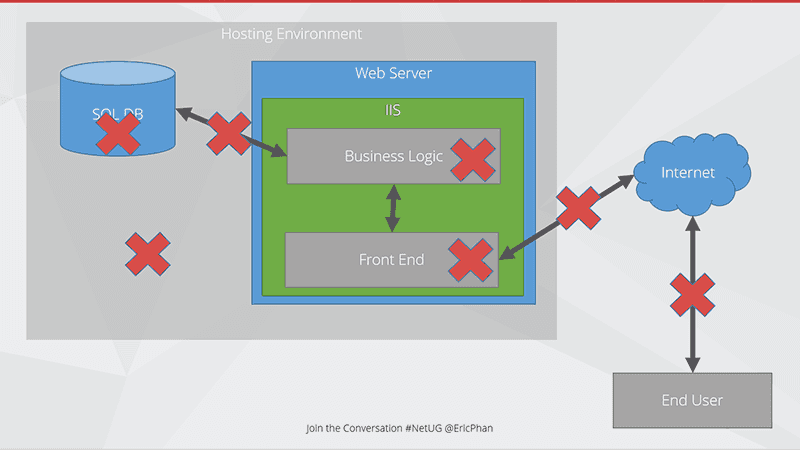
Figure: Bottlenecks can happen anywhere! Call out diagrammatically where you think the bottlenecks are happenning The issues can be in:
SQL Server
- Slow queries
- Timeouts
- Bad configuration
- Bad query plans
- Lack of resources
- Locking
Business Logic
- Inefficient code
- Chatty code
- Long running processes
- Not making use of multicore processors
Front end
- Too many requests to server a page
- Page size
- Large images
- No Caching
Connection between SQL and Web
- Lack of bandwidth
- Too much chatter
Connection between Web and Internet
- Poor uplink (e.g. 1mbps uploads)
- Too many hops
Connection between Web and End users
- Geographically too far (e.g. US servers, AU users)
Infrastructure
- Misconfiguration
- Resource contention
Once you have set up your Application Insights as per the rule 'Do you know how to set up Application Insights' and you have your daily failed requests down to zero, you can start looking for performance problems. You will discover that uncovering your performance related problems are relatively straightforward.
The main focus of the first blade is the 'Overview timeline' chart, which gives you a birds eye view of the health of your application.
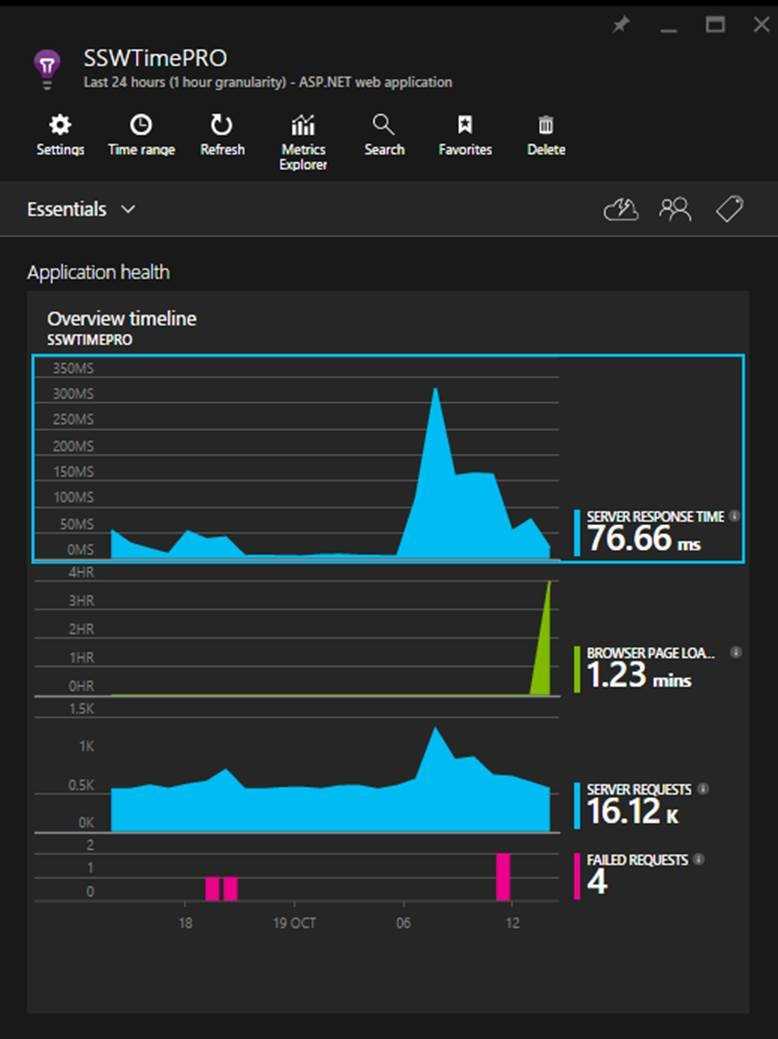
Figure: There are 3 spikes to investigate (one on each graph), but which is the most important? Hint: look at the scales! Developers can see the following insights:
- Number of requests to the server and how many have failed (First blue graph)
- The breakdown of your page load times (Green Graph)
- How the application is scaling under different load types over a given period
- When your key usage peaks occur
Always investigate the spikes first, notice how the two blue ones line up? That should be investigated, however, notice that the green peak is actually at 4 hours. This is definitely the first thing we'll look at.
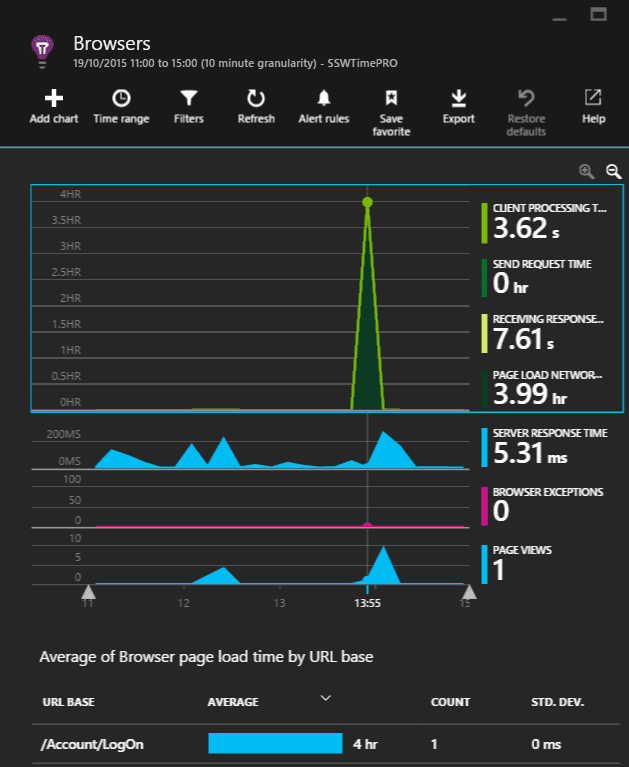
Figure: The 'Average of Browser page load time by URL base' graph will highlight the slowest page. As we can see that a single request took four hours in the 'Average of Browser page load time by URL base' graph, it is important to examine this request.
It would be nice to see the prior week for comparison, however, we're unable to in this section.
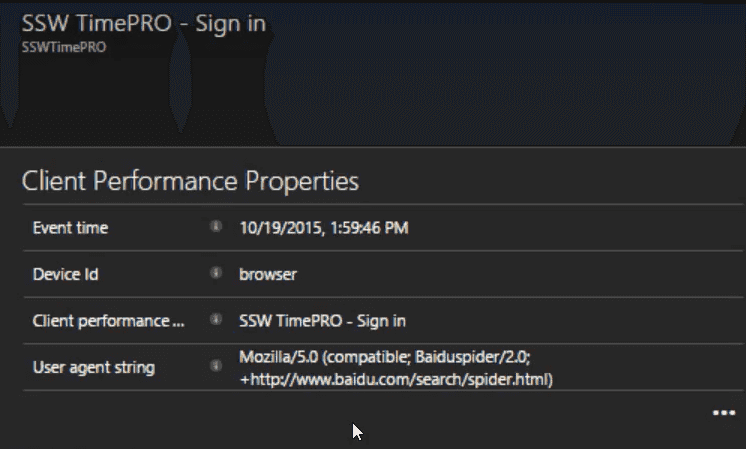
Figure: In this case, the user agent string gives away the cause, Baidu (a Chinese search engine) got stuck and failed to index the page. At this point, we'll create a PBI to investigate the problem and fix it.
(Suggestion to Microsoft, please allow annotating the graph to say we've investigated the spike)
The other spike which requires investigation is in the server response times. To investigate it, click on the blue spike. This will open the Server response blade that allows you to compare the current server performance metrics to the previous weeks.
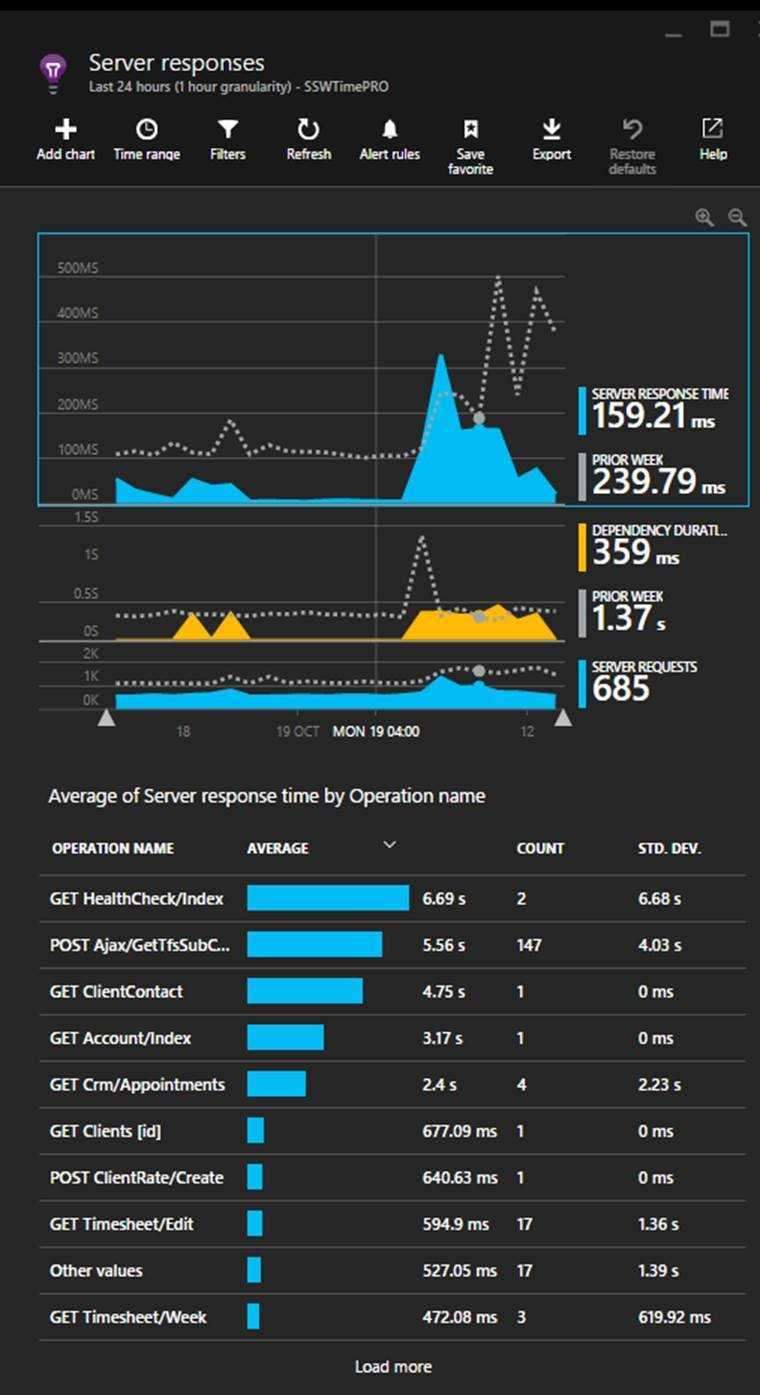
Figure: In this case, the most important detail to action is the Get Healthcheck issue. Now you should be able to optimise the slowest pages In this view, we find performance related issues when the usage graph shows similarities to the previous week but the response times are higher. When this occurs, click and drag on the timeline to select the spike and then click the magnifying glass to ‘zoom in’. This will reload the ‘Average of Server response time by Operation name’ graph with only data for the selected period.
Looking beyond the Average Response Times
High average response times are easy to find and indicate an endpoint that is usually slow - so this is a good metric to start with. But sometimes a low average value can contain many successful fast requests hiding a few much slower requests.
Application insights plots out the distribution of response time values allowing potential issues to be spotted.
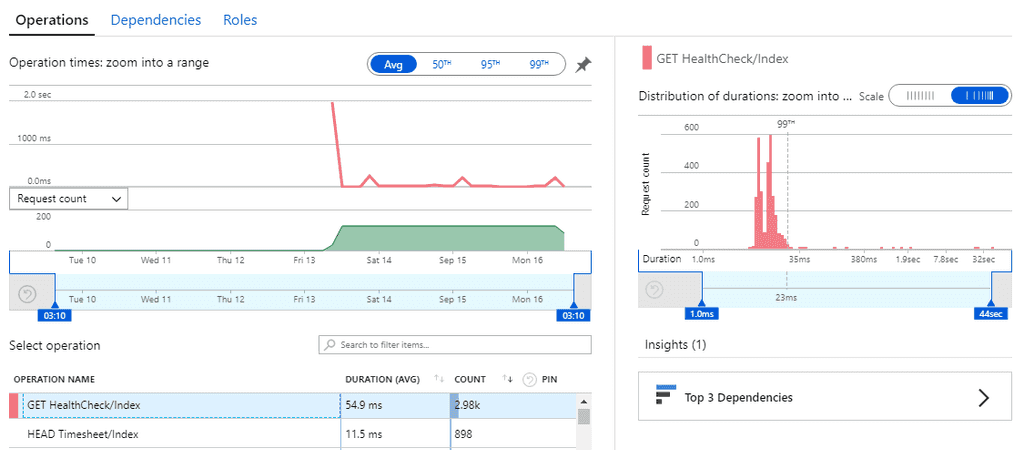 **Figure: this distribution graph shows that under an average value of 54.9ms, 99% of requests were under 23ms but there were a few requests taking up to 32 seconds!
**
**Figure: this distribution graph shows that under an average value of 54.9ms, 99% of requests were under 23ms but there were a few requests taking up to 32 seconds!
**Working out why the performance of an application has suddenly degraded can be hard. This rule covers some investigations steps that can help determine the cause of performance problems.
1. Use Application Insights to determine when the application last had acceptable performance
Follow the Do you know how to find performance problems with Application Insights? rule to determine when the decrease in performance began to occur. It's important to determine if the performance degradation occurred gradually or if there was a dramatic drop-off in performance.
2. Look for changes that coincide with the performance issue
There are three general cases that can cause performance issues:
- A change to software or hardware. Your deployment tool (such as Octopus) can tell you if there has been a software deployment, and you can work with your network admin to determine if there has been infrastructure changes.
- The load factor on the application can change. Application Insights can help you determine if the load factor on the application has increased.
- A hardware issue or network issue can occur that interferes with normal operation. The Windows Event Log and other sys admin monitoring tools can alert you to infrastructure issues like this.
3. Dealing With Code Related Issues
If a software release has caused the performance problems, it is important to work out the code delta between the software release that worked well and the new release with the performance issues. Your software repository should have the necessary metadata to allow you to trace code deltas between release numbers. Inspect all the changes that have occurred for obvious performance issues like bad EF code, unnecessary loops and chatty network calls. See Do you know where bottlenecks can happen? for more information on performance issues that can be introduced with code changes.
4. Dealing with Database Related Issues
Application Insights can help determine which tier of an application is performing poorly, and if it is determined that the performance issue is occurring in the database, SQL Server makes finding these performance issues much easier.
Tip: Azure SQL can provide performance recommendations based off your application usage and even automatically apply them for you.
Query Store is like having a light-weight version of SQL Profiler running all the time, and is enabled at a database level using the Database Properties dialog:
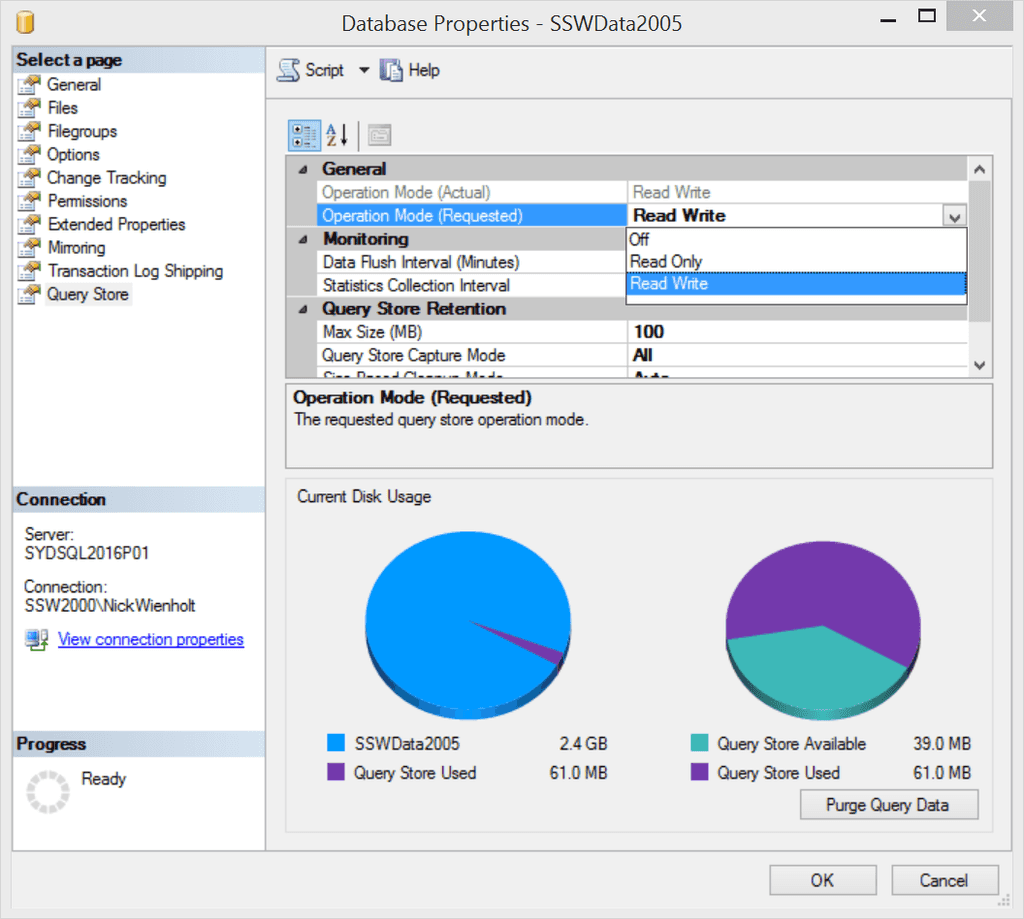
Figure: Read Write indicates that the Query Store is setup to help us a few days later Once Query Store has been enabled for a particular database, it needs to run for a number of days to collect performance data. It is generally a good idea to enable Query Store for important production databases before performance problems occur. Detailed information on regressed queries, overall resource consumption, the worst performing queries, and detailed information such as query plans for a specific SQL statement can then be retrieved using SQL Server Management Studio (SSMS).
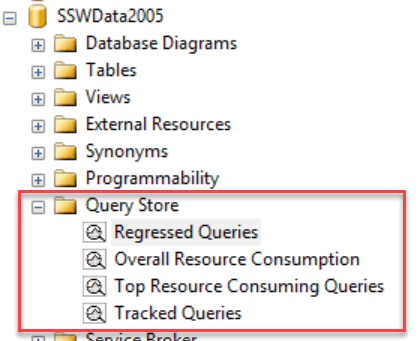
Figure: A couple of days later… Query Store can now be queried to determine which queries are now performing poorly Once Query Store has been collecting performance information on a database for an extended period, a rich collection of information is available. It is possible to show regressed queries by comparing a Recent time interval (2 weeks in the diagram below) compared to a baseline History period (the Last Year in the diagram below) to see queries that have begun to perform poorly.
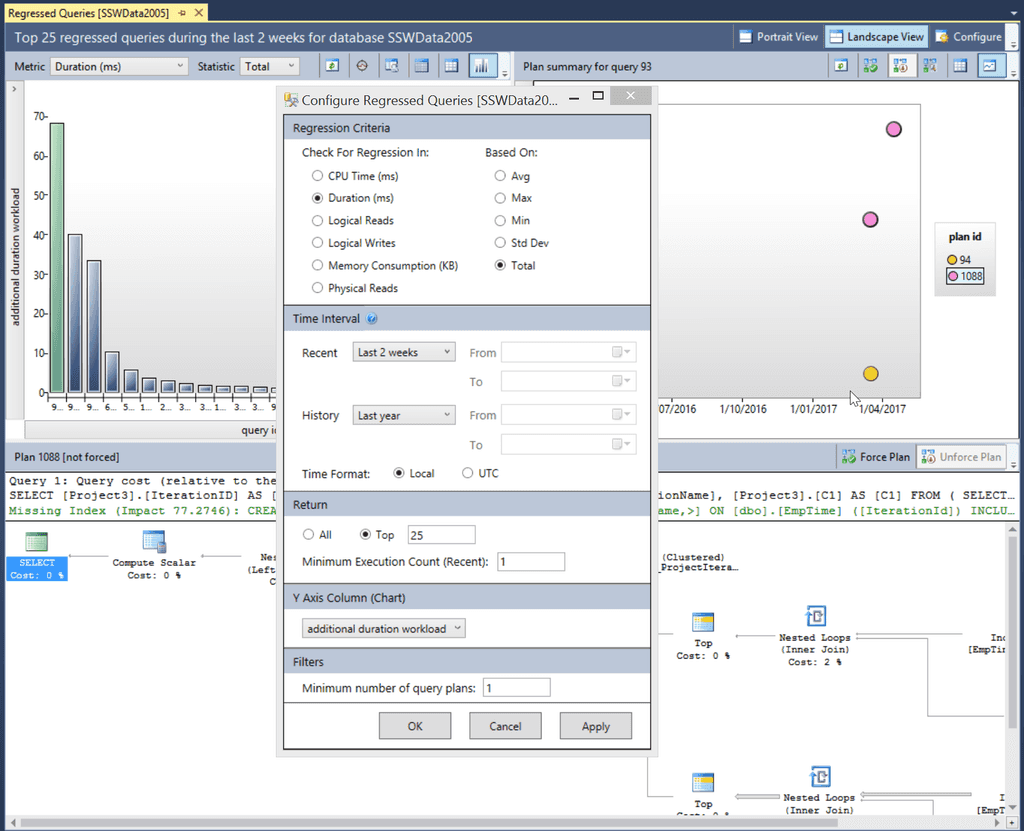
Figure: The query store can show the top 25 regressed queries in the last 2 weeks and give suggestions on how to improve them In the diagram we can see the total duration for a query (top left), the execution plans that have been used on a particular query (top right) and the details of a selected execution plan in the bottom pane. The actual SQL statement that was executed is also visible, allowing the query to be linked back to a particular EF code statement.
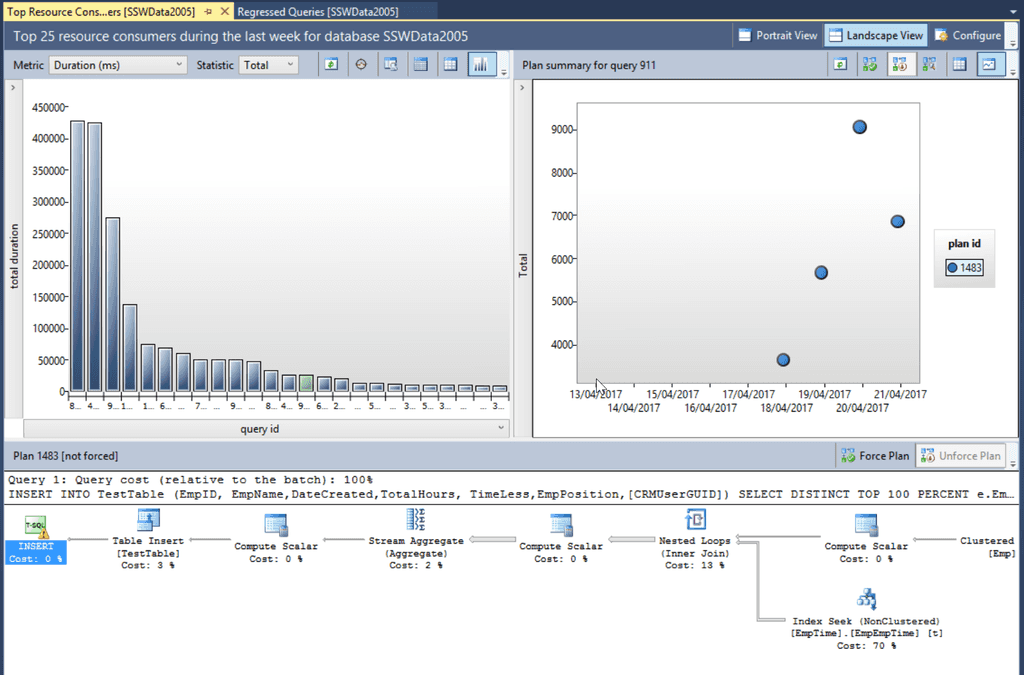
The Top Resource Consuming Queries tab is extremely valuable for performance tuning a database. You can see the Top 25 Queries by:
- Duration
- CPU Time
- Execution Count
- Logical Reads
- Logical Writes
- Memory consumption
- Physical Reads
All of these readings can be broken down using the statistical measures of:
- Total
- Average
- Min
- Max
- Std Deviation
As with the Regressed Queries tab, the query plan history and details of a particular query plan are available for inspection. This provides all the required information to track down the part of the application that is calling the poorly performing SQL, and also provides insight into how to fix the poor performance depending on which SQL step is taking the most time.
If you access unmanaged resources (e.g. files, database connections etc.) in a class, you should implement
IDisposableand overwrite theDisposemethod to allow you to control when the memory is freed. If not, this responsibility is left to the garbage collector to free the memory when the object containing the unmanaged resources is finalized. This means the memory will be unnecessarily consumed by resources which are no longer required, which can lead to inefficient performance and potentially running out of memory altogether.public class MyClass { private File myFile = File.Open(...); // This is an unmanaged resource } //elsewhere in project: private void useMyClass() { var myClass = new MyClass(); /* Here we are using an unmanaged resource without disposing of it, meaning it will hang around in memory unnecessarily until the garbage collector finalizes it */ }Figure: Bad example - Using unmanaged resources without disposing of them when we are done
public class MyClass : IDisposable
{
  private File myFile = new File.Open(...); // This is an unmanaged resource

  public void Dispose()
  {
    myFile.Dispose(); // Here we dispose of the unmanaged resource
    GC.SuppressFinalize(this); // Preventing a redundant garbage collector finalize call
  }
}
Figure: Good example - Implementing
IDisposableallows you to dispose of the unmanaged resources deterministically to maximize efficiencyNow we can use the
usingstatement to automatically dispose the class when you are finished with it.:private void useClass() { using (var myClass = new MyClass()) { // do stuff with myClass here... } // myClass.Dispose() is automatically run at the end of the using block }Figure: Good example - With the
usingstatement, the unmanaged resources are disposed of as soon as we are finished with themSee here for more details.
A String object is immutable - this means if you append two Strings together, the result is an entirely new String, rather than the original String being modified in place. This is inefficient because creating new objects is slower than altering existing objects.
Using StringBuilder to append Strings modifies the underlying Char array rather than creating a new String. Therefore, whenever you are performing multiple String appends or similar functions, you should always use a StringBuilder to improve performance.
String s = "";

for (int i = 0; i < 1000; i ++) {
  s += i;
}
Figure: Bad example - This inefficient code results in 1000 new String objects being created unnecessarily
StringBuilder sb = new StringBuilder();

for (int i = 0; i < 1000; i ++) {
  sb.append(i);
}
Figure: Good example - This efficient code only uses one StringBuilder object
See StringBuilder Class for more details.
Load testing places a simulated "load" or demand on your web application and measures how it responds to that load, recording such valuable metrics as:
- Throughput rates
- Resource and environment utilization (e.g. CPU, physical memory, etc.)
- Error rates
- Load balancer performance
Load testing tools are designed to help you perform load testing, by recording metrics about the application as the load is varied and allowing you to visualize where user load impacts performance and/or causes application errors.
Choosing a load testing tool
There are a number of factors to take into account when choosing a tool to help you with load testing, including:
- The number of users you want to simulate
- The infrastructure you have available
- The cost model
Number of users and infrastructure
Most commercial load testing tools will support some number of virtual users when running the tests on your hardware. For more significant, real-world loads, however, cloud-based offerings provide the opportunity for almost unlimited scale.
For small user loads, utilizing your own hardware may be sufficient. For larger loads, the tests will likely need to be run on some type of cloud infrastructure (either provided by the tool vendor or your own preferred service, e.g. Microsoft Azure). The ability to scale load tests on demand via cloud resources has made large-scale load testing much more feasible for modern applications.
Cost model
There are many different load testing tools to choose from. Some of the most popular tools are open source (e.g. Apache's JMeter) and there are many commercial tools offering additional features and support. Your choice of tool will depend on budget and suitability for purpose.
Some of the best load testing tools
- JMeter (open source, Apache)
- k6 (open source and SaaS offering, Grafana)
- LoadRunner (Micro Focus)
- Blazemeter (Perforce)
- Loader.io (SendGrid)
- LoadView-testing.com (Dotcom-Monitor)
Note: Azure Load Testing is a fully managed load-testing service that enables you to generate high-scale load. It uses JMeter to generate the loads. Note that this service is currently only in Preview.
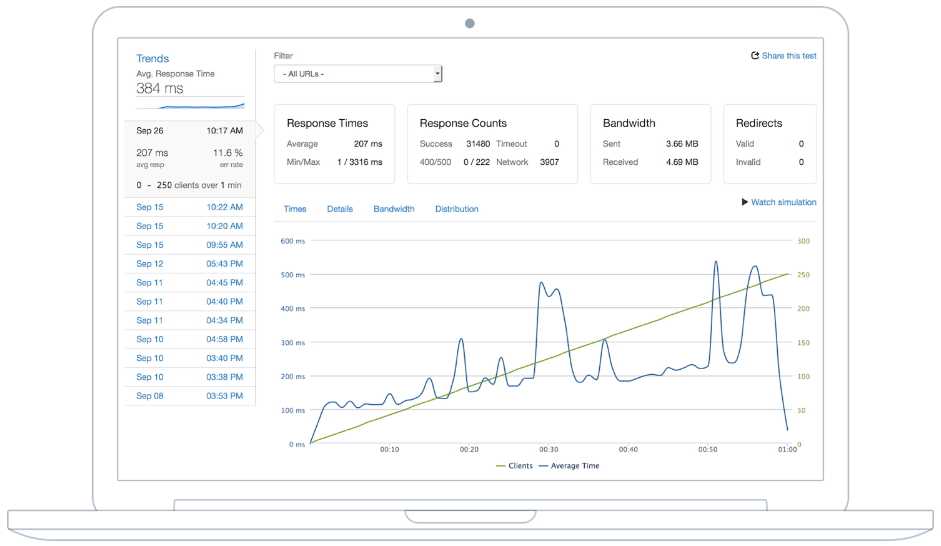
Figure: Loader.io load testing results 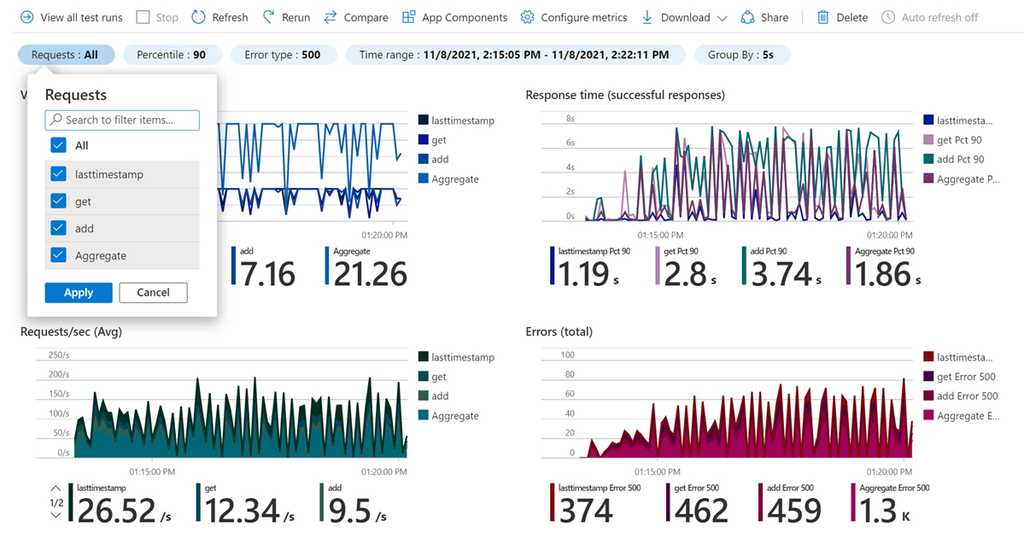
Figure: Azure Load Testing results The infrastructure that your application is deployed to is often never tested but can be the culprit for performance issues due to misconfiguration or virtual machine resource contention. We recommend setting up a simply load test on the infrastructure like setting up a web server that serves 1 image and having the load tests simply fetch that image.
This simple test will highlight:
- Maximum performance you can expect (are your goals realistic for the infrastructure)
- Identify any network related issues
- Uplink bandwidth, DDOS protection, firewall issues

Figure: Work out the maximum performance of the infrastructure before starting Note: if you have other servers in the mix, then you can make another simple test to pull records from the database to check the DB server as well.
Measuring which pages receive the most hits will help a great deal when looking to optimise your website.
- Measuring usage will help to determine the current business value of a page or feature
- Optimising a highly used page will have a higher impact on overall system performance
A number of great tools exist to find the highest hit pages.
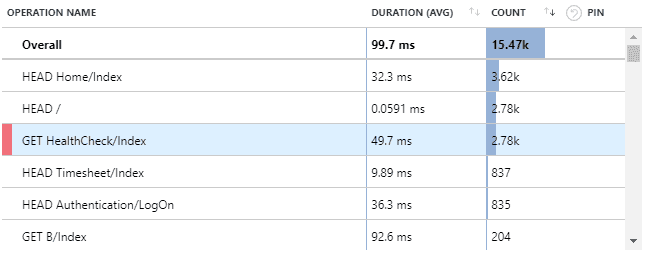
Figure: Application Insights can return request counts under the performance screen 
Figure: Google Analytics provides powerful usage statistics Like any development, performance optimization requires development time and should therefore be prioritized for business value.
Include the following considerations:
- What is the preferred performance for this feature?
- What represents an acceptable performance metric?
- How many users are expected to use this feature within a timeframe?
- What is the business impact of poor performance for this feature?
- Are we planning to significantly change this feature in the near future?
Hi Adam,
As per our conversation, we have identified 2 slow queries:
Query 1: On the “Edit Item” screen (admin only) we have identified 4 separate SQL queries that can be rewritten as one. We estimate that this will reduce the response time by 1.5 seconds. Only a few admin users will be affected Query 2: On the Home page is a query that currently takes 1 second that we can reduce to ½ a second. This affects all users.
We optimized the "Edit Item" page because that had the biggest measurable improvement.
Bad example: Although the admin page has a bigger potential saving, the home page affects all users and therefore probably has a higher business value. Business value should be determined by the Product Owner, not the developer
Hi Adam,
As per our conversation, we have identified a query in the "Save Timesheet" endpoint that often takes more than 2 seconds to complete – well beyond the project’s 800ms target. However, this entire feature is scheduled to be migrated from MVC to Angular in the next Sprint.
Recommended actions:
- We won't optimize the existing implementation
- Raise the priority of the Angular migration PBI
- Ensure that performance metrics are included in the acceptance criteria of the migration PBI
- Please “reply all” with changes or your acceptance.
Good example: There is little business value in optimizing code that will soon be replaced – but the final decision on business value is left to the Product Owner
IO-Bound operations are operations where the execution time is not determined by CPU speed but by the time taken for an input/output operation to complete.
Examples include:
- Reading from a hard disk
- Working with a database
- Sending an email
- HTTP REST API calls
It's important to note that all these IO operations are usually several orders of magnitude slower than performing operations against data in RAM.
Modern .NET applications provide a thread pool for handling many operations in parallel. Threads are pooled to mitigate the expense of thread creation and destruction.
If an individual thread is waiting for IO to complete, it is IO blocked and cannot be used to handle any more work until that IO operation is finished.
When using async, the thread is released back to the thread pool while waiting for IO, while the await keyword registers a callback that will be executed after IO completion.
The async/await pattern is most effective when applied “all the way down”. For ASP.NET web applications this means that the Controller Action – which is usually the entry point for a request into your application – should be async.
public ActionResult Gizmos()
{
    var gizmoService = new GizmoService();
    return View("Gizmos", gizmoService.GetGizmos());
}
Figure: Bad example – This MVC Controller Action endpoint is not async so the thread assigned to process it will be blocked for the whole lifetime of the request
public async Task<ActionResult> GizmosAsync()
{
    var gizmoService = new GizmoService();
    return View("Gizmos", await gizmoService.GetGizmosAsync());
}
Figure: Good example - This MVC Controller Action is async. The thread will be released back to the threadpool while waiting for any IO operations under the “gizmoService” to complete
Above code examples are based on: Using Asynchronous Methods in ASP.NET MVC 4
With these async/await patterns on .NET Core, our applications can handle very high levels of throughput.
Once an async/await based app is under heavy load, the next risk is from thread-pool starvation. Any blocking operations anywhere in the app can tie up threadpool threads – leaving fewer threads in the pool to handle the ongoing throughput. For this reason, the best practice is to ensure that all IO-bound operations are async and to avoid any other causes of blocking.
For more information on understanding and diagnosing thread pool starvation, read: Diagnosing .NET Core ThreadPool Starvation with PerfView (Why my service is not saturating all cores or seems to stall).
Further Information
The Open Web Application Security Project (OWASP) is a non-profit charity organization whose sole purpose is to enable other organizations to develop applications that can be trusted. Their most prominent piece of literature is the OWASP Top 10 – a list of the most critical risks found in software. It is a “living” list, which means it is updated as vulnerabilities become known and more or less common.
OWASP Top 10 2021
The current OWASP Top 10 states the following are the top risks for web applications today. Knowing and securing against these will give the biggest bang-for-buck in securing your website.
- Broken Access Control: Insufficient controls in place to implement the principle of least privilege, insufficient access control protections
- Cryptographic Failures: Data transmitted in clear text, sensitive data not encrypted at rest, using weak or broken cryptography algorithms
- Injection: Failure to validate user-supplied data, queries not parameterized
- Insecure Design: Security not considered as a baseline principle, security added as an after-thought (essentially, need to "shift-left" security)
- Security Misconfiguration: Insecure default configurations, misconfigured HTTP headers and verbose error messages containing sensitive information
- Vulnerable and Outdated Components: Packages and dependencies not kept up to date, versions with known vulnerabilities kept in the product
- Identification and Authentication Failures: Brute force attacks, credential stuffing, missing MFA, permits weak passwords, simple password recovery
- Software and Data Integrity Failures: Failure of infrastructure configuration to protect against exploits, e.g. supply chain attacks, dependency package spoofing
- Security Logging and Monitoring Failures: Not logging security events, not monitoring or auditing logs, not raising alerts for suspicious events
- Server-Side Request Forgery: Arbitrarily fetching data from user supplied URLs
Other resources
Protecting against these is a large topic in their own right. There are plenty of resources with information on protecting against these, linked below:
- Troy Hunt – Protecting your web apps from the tyranny of evil with OWASP - This video goes through the OWASP Top 10 in more detail, describing each risk, how to exploit it, and how to protect against it
- OWASP Top 10 - The OWASP home page is a little difficult to navigate but contains fantastic information on the risks and how to protect against them. Use the link above to get details on each of the vulnerabilities, with examples on attacking, “Cheat Sheets” for prevention and risk/impact assessment
Traditionally you would only seal a class if you wanted to prevent it from being inherited. This is a good practice, but it's also a good practice to seal all classes by default and only unseal them when you need to inherit from them.
On the surface it appears that you are just preventing someone from inheriting from your class, but there are a few other benefits to sealing your classes by default:
- Performance gains
- Only things that are designed to be inherited can be inheritable
- Inheritance can be easily abused and as a result is considered a minor anti-pattern
- Composition is preferred over inheritance
Watch this video by Nick Chapsas, to see the performance benefits of sealing your classes for different usage scenarios:
Video: Why all your classes should be sealed by default in C# by Nick Chapsas (11 min)Avoid unnecessary covariance checks in Array
Arrays in .NET are covariant. This means arrays enable implicit conversion of an array of a more derived type to an array of a less derived type. This operation is not type safe. To make sure it’s type safe JIT checks the type of the object before an item is assigned which is a performance cost.
When the array is an array of sealed types, JIT knows there won’t be any covariance involved when sealed types are used, so it skips covariance checks. This improves performance with arrays.
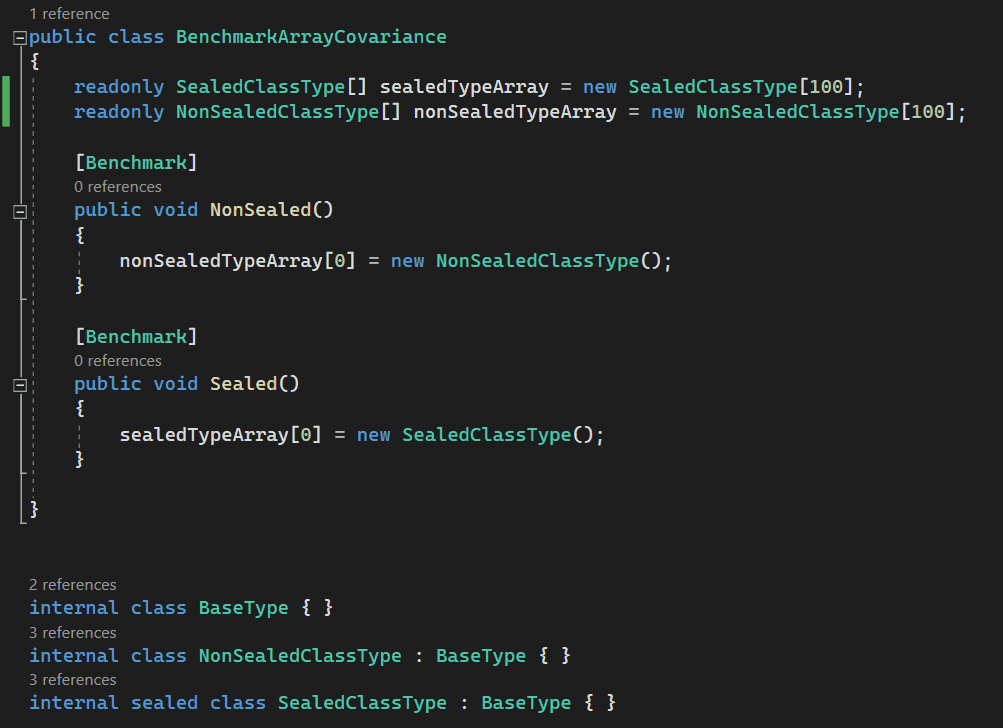
Figure: Array covariance - sealed Vs non-sealed. See the next figure for performance results 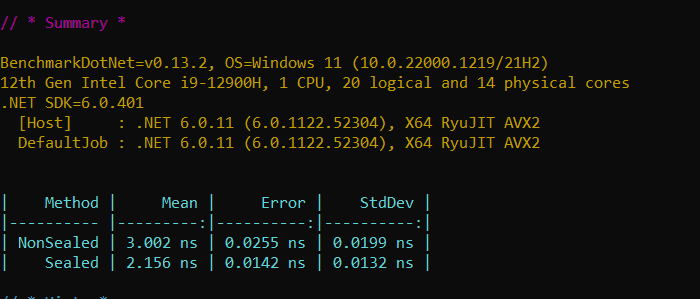
Figure: Performance results show arrays with sealed types show improved performance compared to arrays with non-sealed types Skip hierarchy checks of inheritance in runtime for is/as cast operations
During a cast operation, JIT needs to know the type of the object at runtime. When casting to a non-sealed type, the runtime must check all the types in the inheritance hierarchy, which can be time consuming.
When casting to a sealed type, the runtime only checks the type of the object. Hence the performance gain.
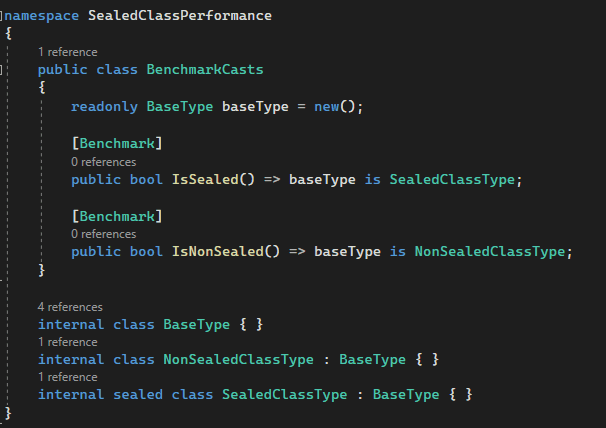
Figure: Casting sealed Vs non-sealed. See the next figure for performance results 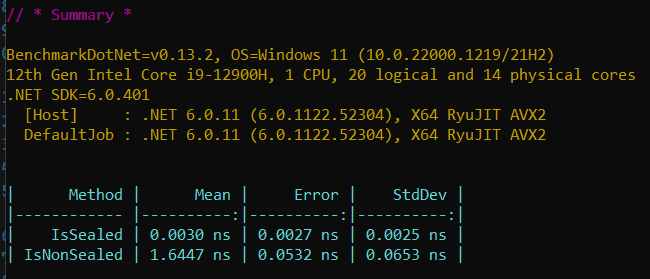
Figure: Performance results show casting of sealed has improved performance compared to non-sealed
