Rules to Better Google Analytics Reports - 3 Rules
Enhance your Google Analytics reporting skills with these essential rules, covering the integration of tracking codes and the effective use of content reports to analyze trends.
Google Analytics gives you a great insight into how, when and where your website is used. If you're not using an analytics package in your website, you're flying blind when it comes to understanding how, when and where your website is used.
Video: How To Setup Google Analytics In 2025 - Complete Tutorial (9 min)By using Google Analytics, you will be able to see what your visitors are viewing and what they aren't, what they spend large amount's of time on, what pages are causing errors, what pages are directing visitors to you, which browsers and devices are being used to see your site and more. All this information help you better structure your site to what your visitors like. It also allows you to compare site traffic from one month to another.
The most useful reports:
- Number of users
- Which are the most popular pages of your website
- Time spent on the website
- Geographical origin of users
- Which sites are referring the most hits to you (e.g. search engines)
- Which keywords are bringing users to your site
- If you have downloads, which are the most popular
Adding Google Analytics to websites
To add Google Analytics to your website:
- Log into your Google account
- Go to Admin
- Create a new Account (if needed) and a new Property
- Specify your website details
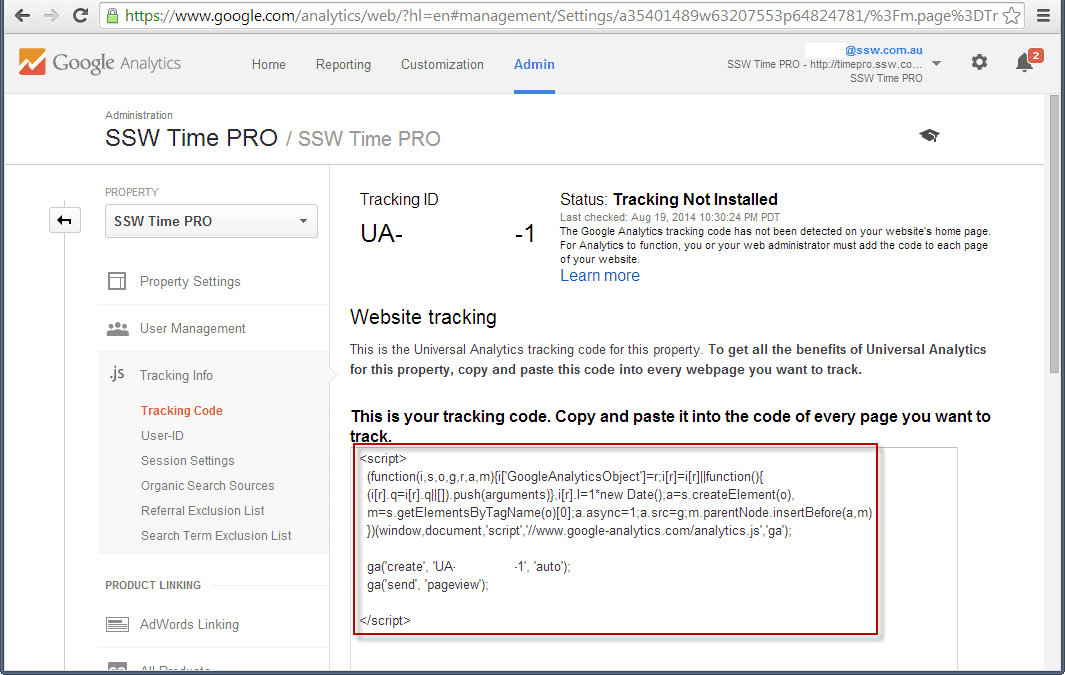
- Find your Tracking Code
- Add the script to your website
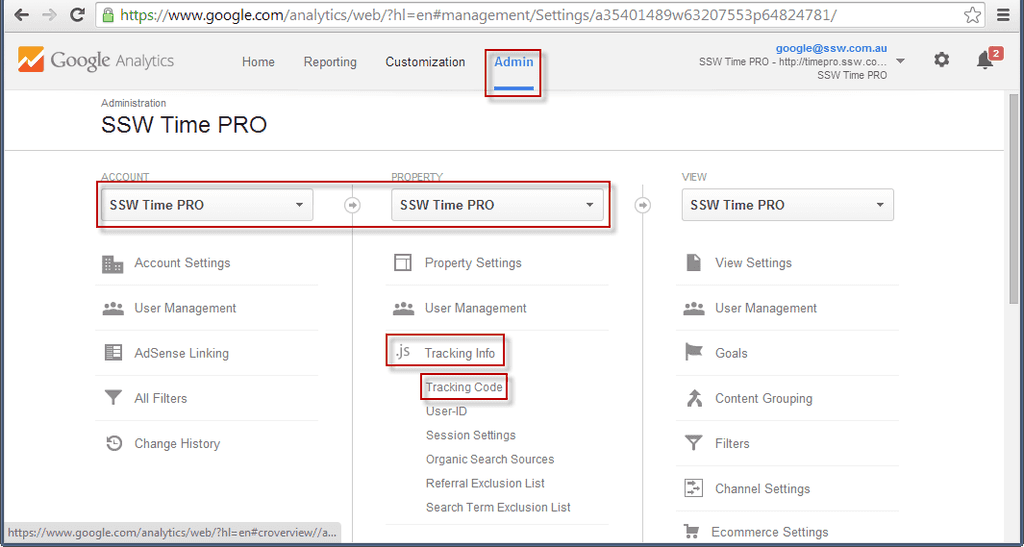
Figure: Navigate to the Tracking Code property From this page, you will be able to get a JavaScript snippet to include in your application.
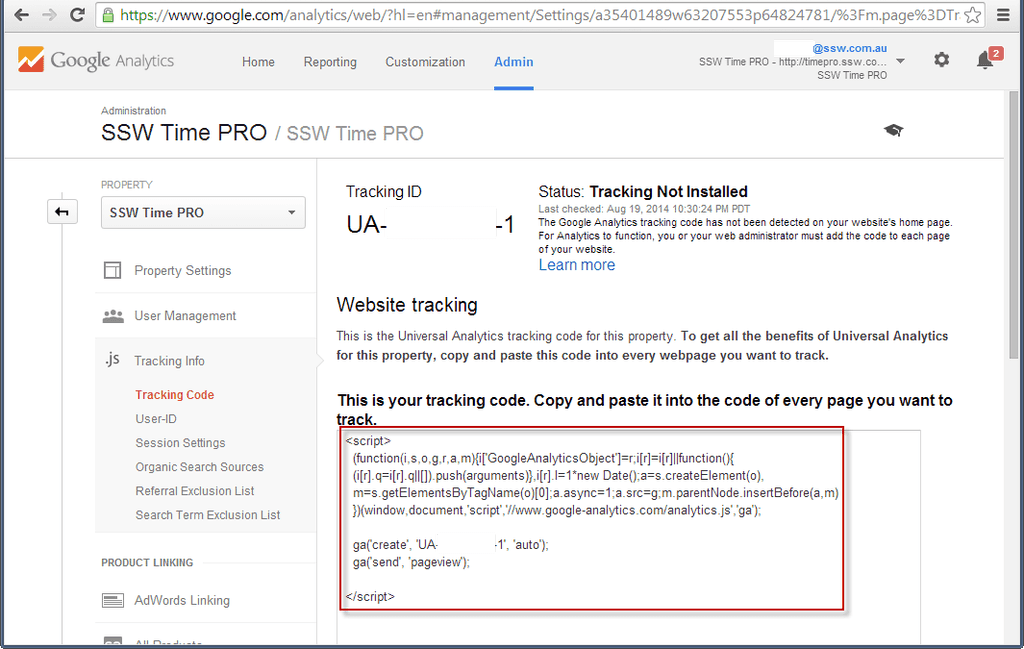
Figure: Include this JavaScript in your web application 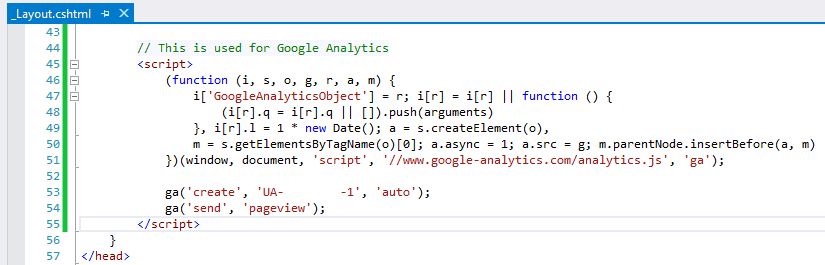
Figure: The JavaScript code in HTML Once deployed, this script will start tracking metrics and interacting with Google Analytics. You are good to go!
More information on Set up Analytics for a website and/or app.
Adding Google Analytics to blogs
Using the above instructions, you can add Google Analytics to any website, including any blog. However, you may also find that your blogging platform or theme provides a way to set up Google Analytics using a plugin or other simple approach. Check your theme's documentation - sometimes it's as simple as adding the tracking code to configuration. Of course, adding the above JavaScript is easy enough in any case.
Plausible - For when Google Analytics is too much
Google Analytics is incredibly powerful, but for many marketing sites, blogs, and small products it can feel like using a 747 cockpit to check your speed.
Some common issues:
- Steep learning curve and cluttered UI for simple questions
- Heavy script that can slow down page loads
- Reliance on cookies and personal data, which means consent banners, adblockers, and missing data
- Tight alignment with Google’s ad ecosystem, which some teams simply don’t want or need
If you just want fast, trustworthy, privacy-friendly insight, it’s worth looking at Plausible Analytics.

Figure: Plausible Analytics is an open source project dedicated to making web analytics more privacy-friendly How Plausible helps
1. Clarity over complexity - Plausible focuses on the essentials (pageviews, top pages, referrals, conversions, campaigns) in a single, clean dashboard. No maze of reports, no custom exploration degree required
2. Privacy-first, usually no cookie banner - Plausible is cookieless and doesn’t collect personally identifiable data or use cross-site tracking. It’s designed to be GDPR/CCPA/PECR friendly out of the box, which often means you can run meaningful analytics without an intrusive consent pop-up
3. More reliable numbers in a blocker-heavy world - Because it’s lightweight, privacy-focused and can be proxied through your own domain, Plausible is less likely to be blocked than traditional tracking scripts. In practice, that can mean more accurate counts of real visitors than a heavily blocked GA4 setup
4. Faster site, happier users - The Plausible script is tiny compared to GA, helping you keep your Core Web Vitals and page experience in good shape. Analytics shouldn’t cost you conversions
5. Open, independent, and self-hostable - Plausible is open source, run by an independent team, with the option to self-host and keep full control over your data if that matters to your organization
If you rely heavily on GA4’s advanced features (ad platform integrations, complex attribution, BigQuery exports), keep it. Otherwise, consider running Plausible alongside GA for a while. It’s a one-line script, easy to test, and for many sites it delivers the important 10% of metrics without the 90% of noise.
Understanding and taking advantage of tracking codes on URLs is very important to working out where to spend your SEO efforts and $$$.
What is the difference in these 2 URLs?
- thetrackr.com
...versus
- thetrackr.com/bravo?utmexpid=98763450-11.FrU2vkRZTECbwLuT78JGA.1&utmsource=facebookads&utmmedium=conversions&utmcampaign=AUEnglishBravoOrderSuccess4LALAgeTargets&utmreferrer=http%3A%2F%2Fm.facebook.com#abtest=b
With the second URL you will get reports like this:
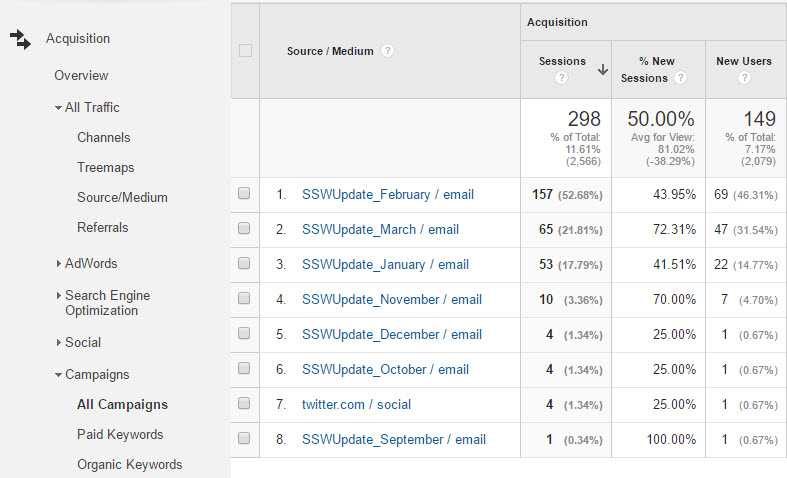
Figure: UTM codes let you track campaigns and referrers in Google Analytics This enables the page owner to find out how visitors are finding the page. For example, if they're advertising ProductX on Google, and on Facebook, and in email blasts, all linking to the same page, they can customise the links from each of these pages with a unique tracking code. This code will identify the traffic that comes from that source, along with other useful information like which advertising campaign the traffic came from.
With the long URL, there's a lot of additional information that can be taken from the link:
- utm - An Urchin Traffic Module (UTM) code is the way that businesses track sales from their origination point (like a tweet, email or a brochure) down the funnel to their conversion page.
- expid – short for 'experiment id' , it relates to using Google Experiments, which is a way of testing different versions of pages to see which one converts the best
- source - The source is where your link is hosted, like search, affiliate website or email campaign name or anywhere else.
- medium – used to identify the medium the link was used upon such as: email, CPC, or other method of sharing.
- campaign - The medium is how it's delivered, like a postcard, PPC, email or social media. The campaign is typically what you're promoting, or the special way you're promoting it (like a holiday sale).
- referrer – this relates to the "expid" code earlier in the URL – it shows which variant of the a/b testing you were referred from (in this case, it is the "b" version of the experiment)
Keeping on top of your website analytics can be daunting given the vast number of reports that are available in Google Analytics.
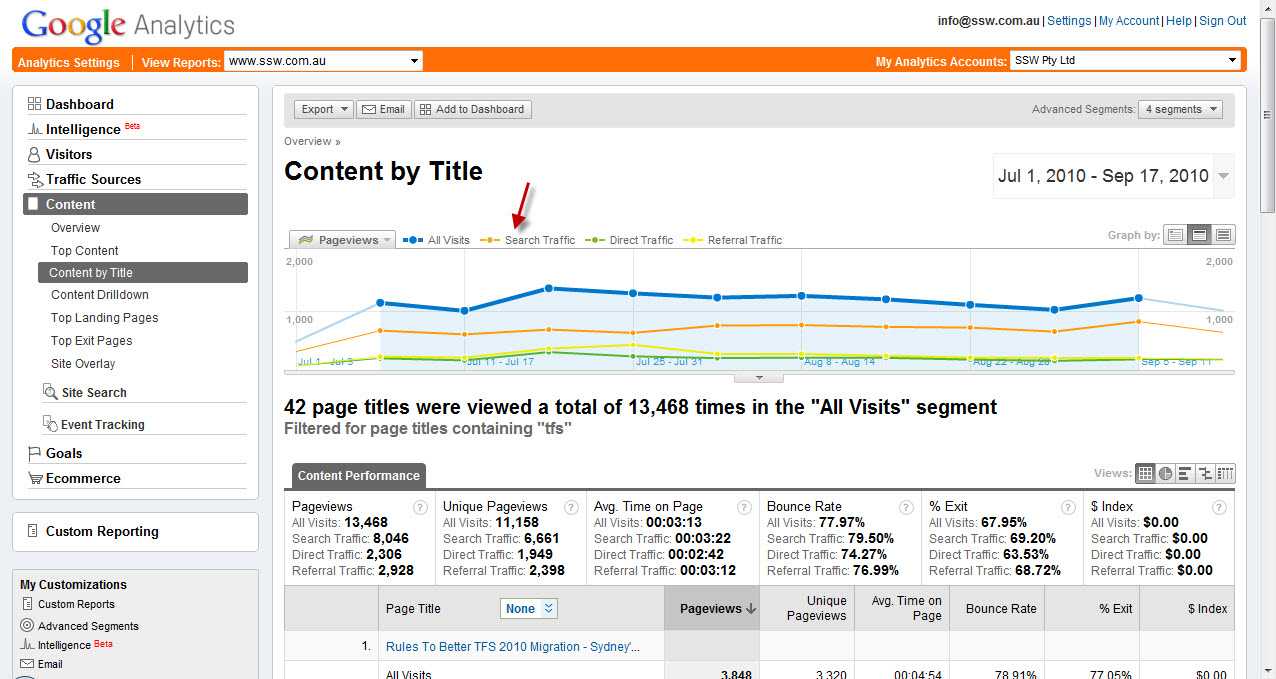
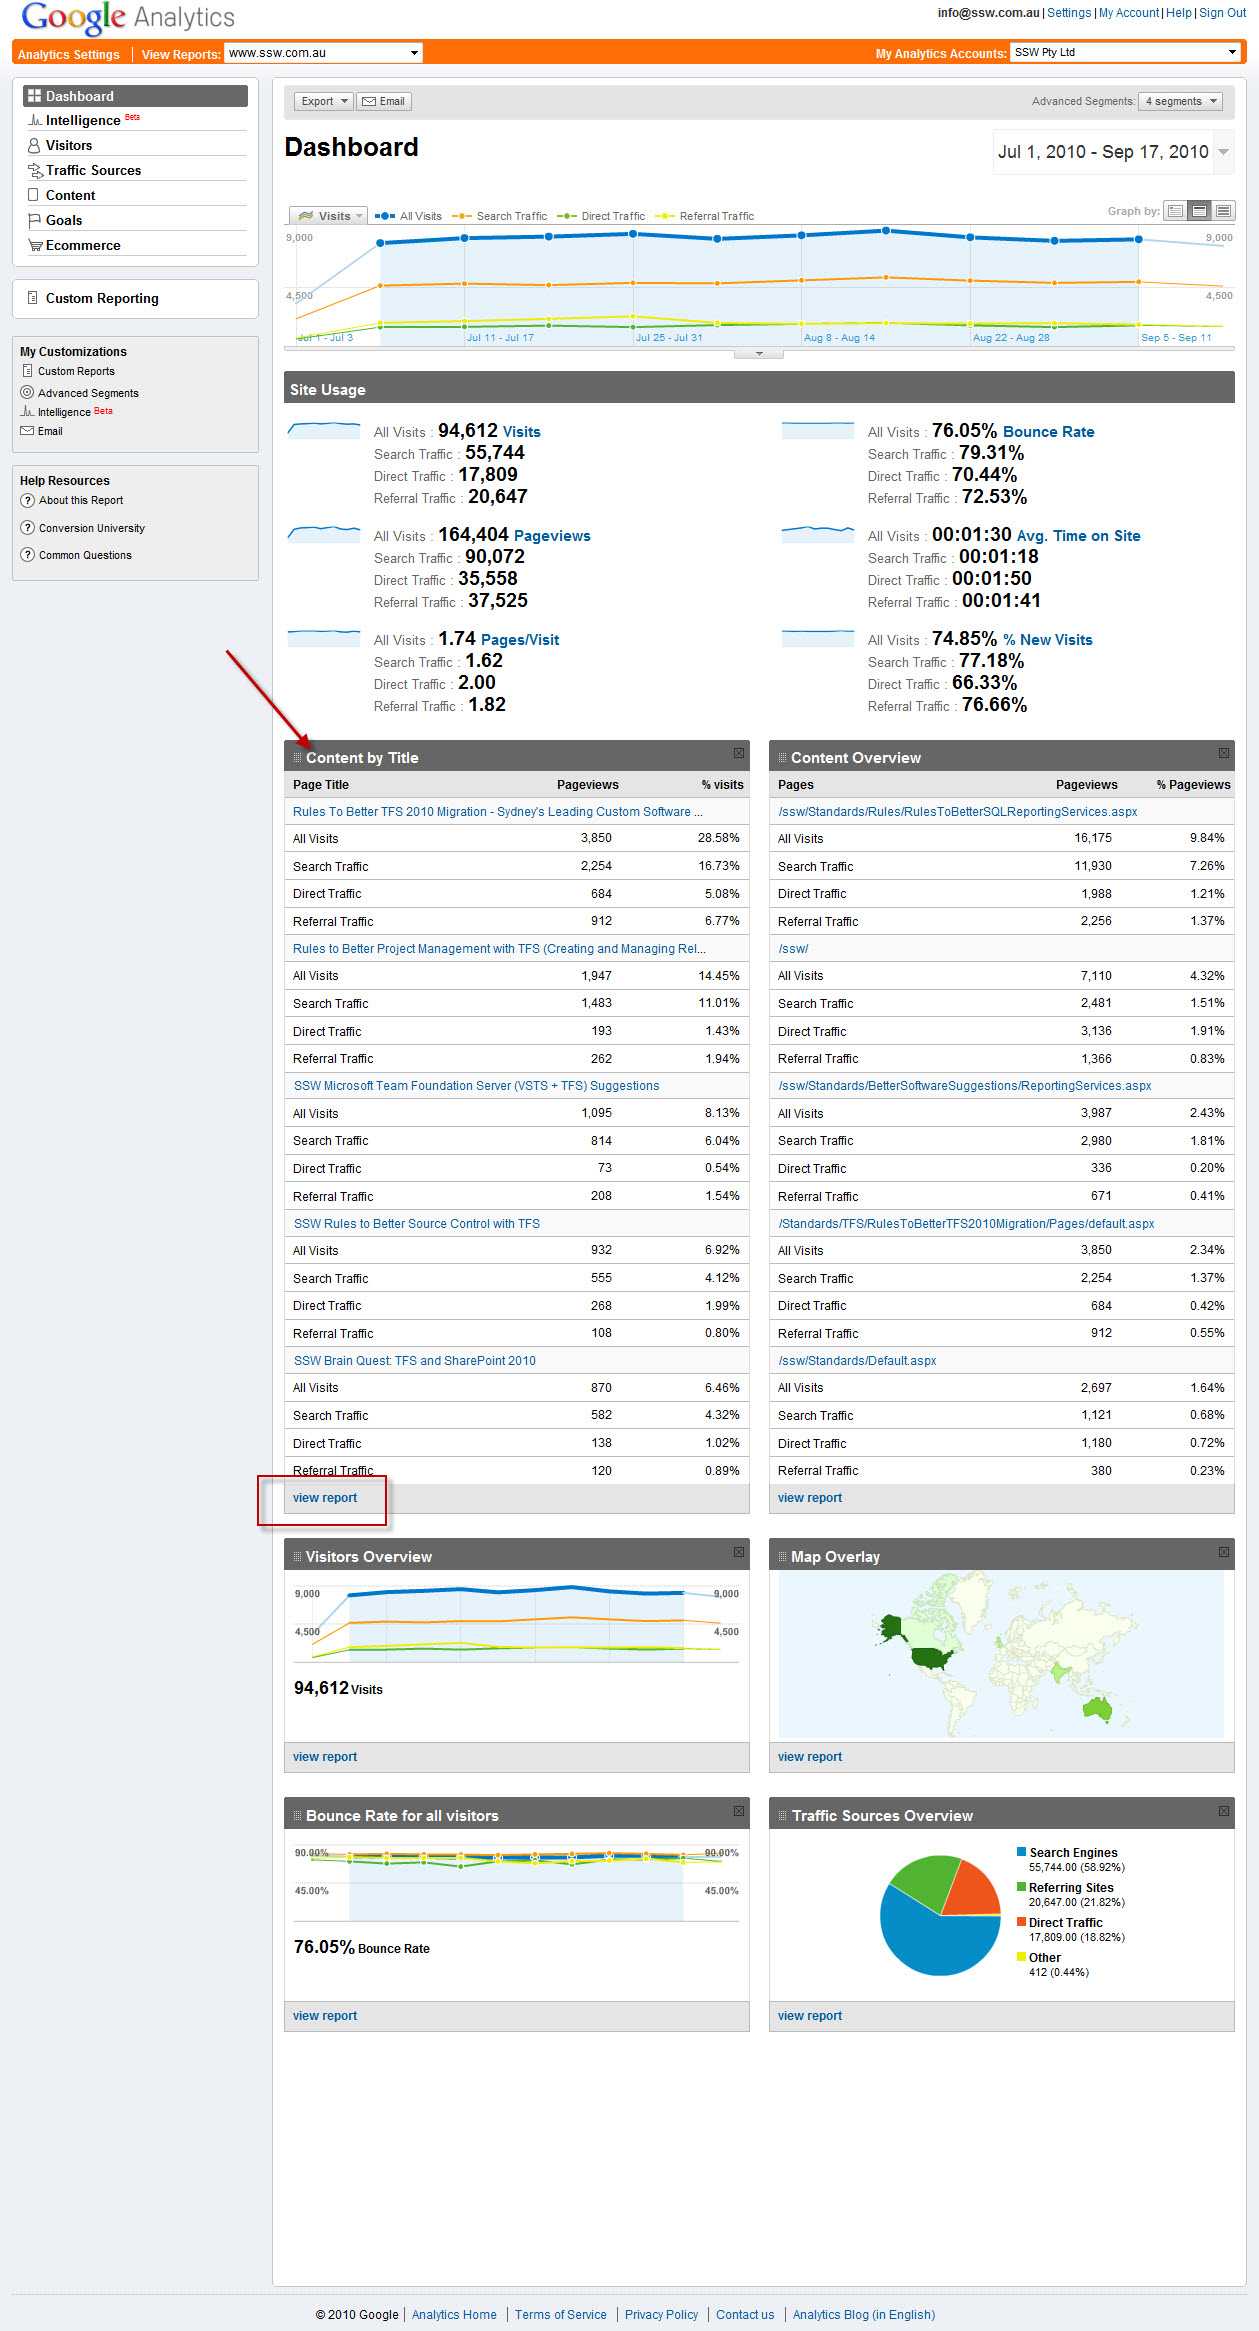
1. Content by Title
Using the Content by Title report is an excellent way to view the improvement in pages that have been created for specific keyword terms.
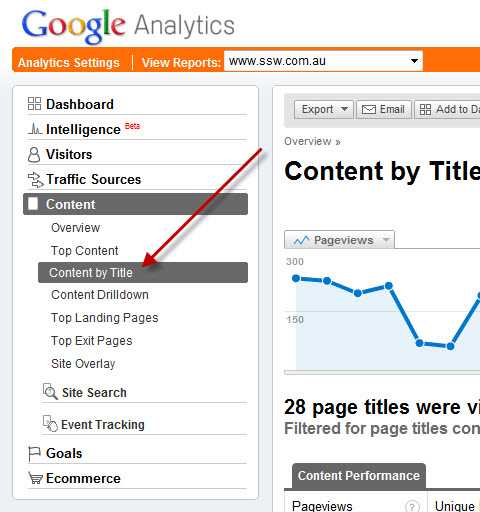
Figure: From the Content Section of the Analytics report pane, choose Content by Title 2. Setting Date Ranges
Choose the date range you want to view (eg 12 months)
3. Filter By Key Term
Filter the report by the keyword term you are interested in viewing (eg TFS or SQL Server or SharePoint, etc). This assumes that you have used these keyword terms in the titles of the pages (see Rules To Better Google Rankings for more details on best practices for increasing your Google presence).
The overall trend of your pageviews should be increasing.
4. View by Day, Week and Month Trends
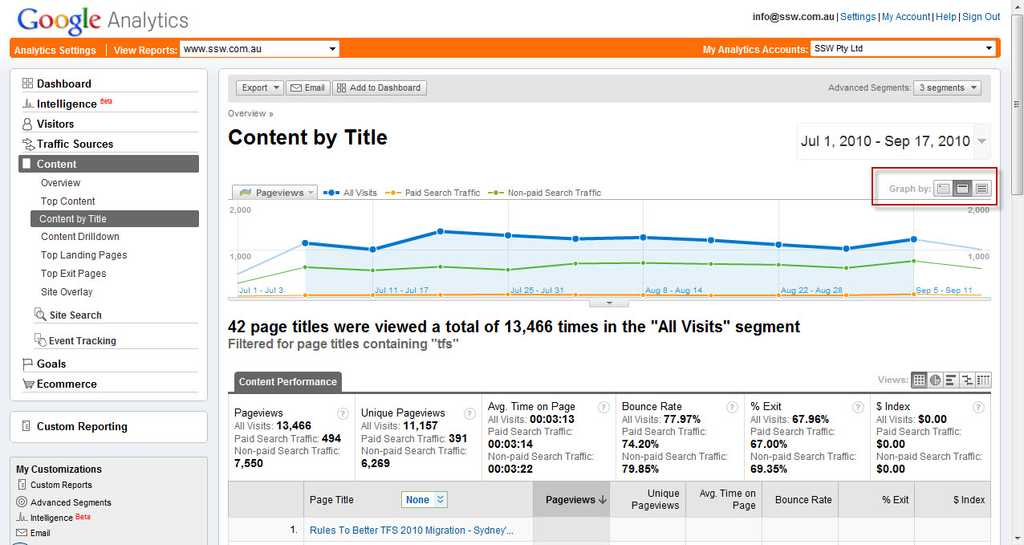
Figure: Use the ‘Graph By’ options to show trends for Weeks and Monthly visits 5. View Segments

Figure: Add Segments to compare your traffic sources including Search, Direct and Referral traffic. You can also compare with paid search traffic (if you are using AdWords to drive traffic) 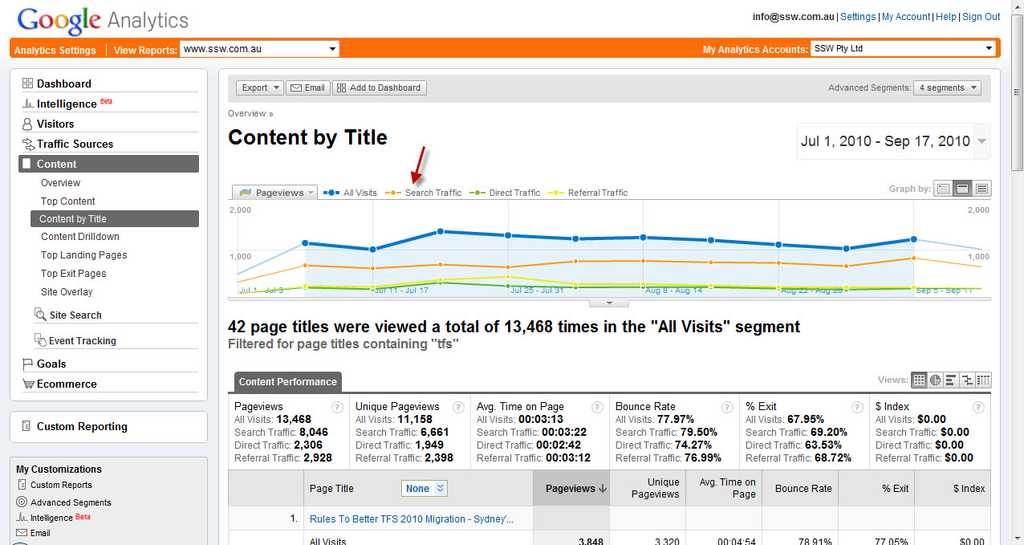
Figure: The main segments to keep an eye on are the Search Traffic and Referral Traffic numbers – ideally both should be increasing 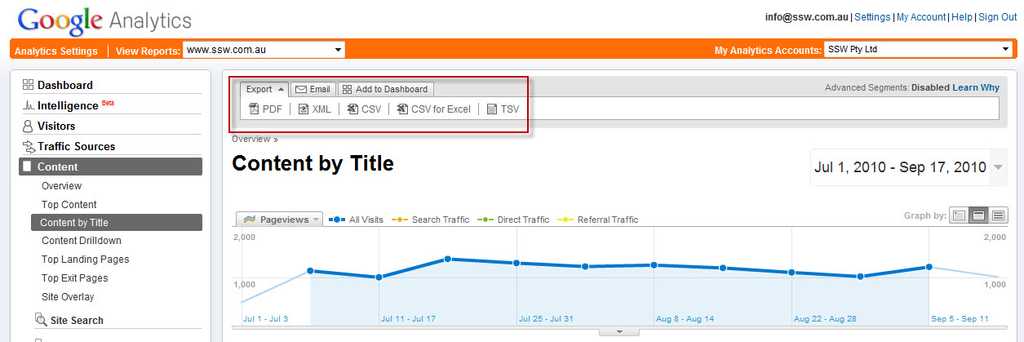
Figure: You can export the report to PDF and Excel, or email it to your boss. Or, print the report and stick on your company noticeboard in a prominent position 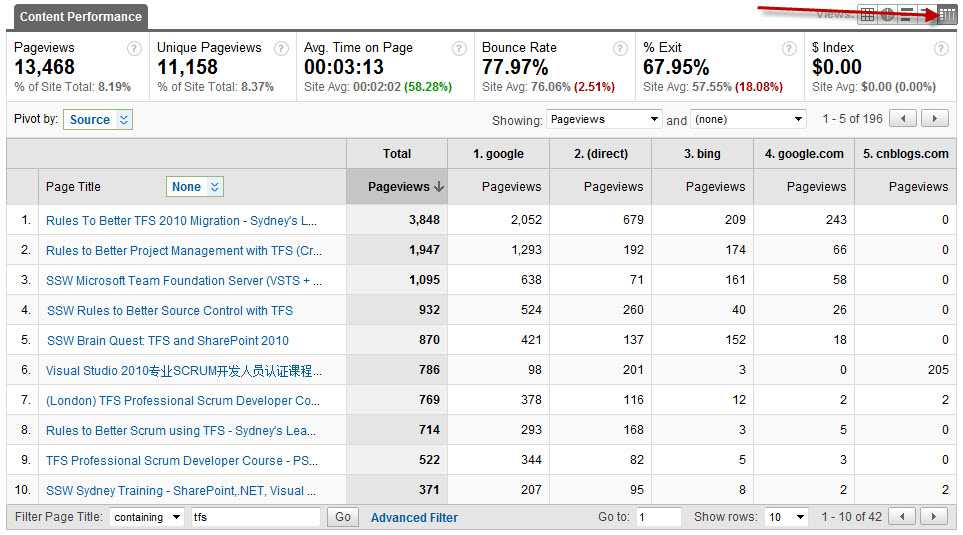
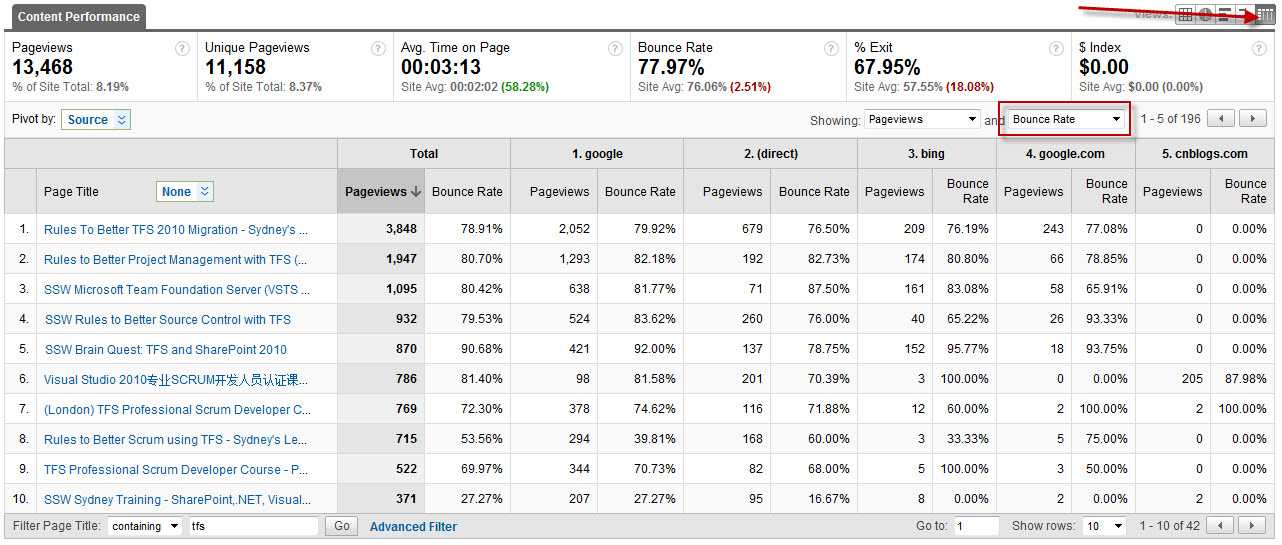
Figure: You can also view the sources of the traffic to see which sites are sending you traffic by clicking on the Pivot View 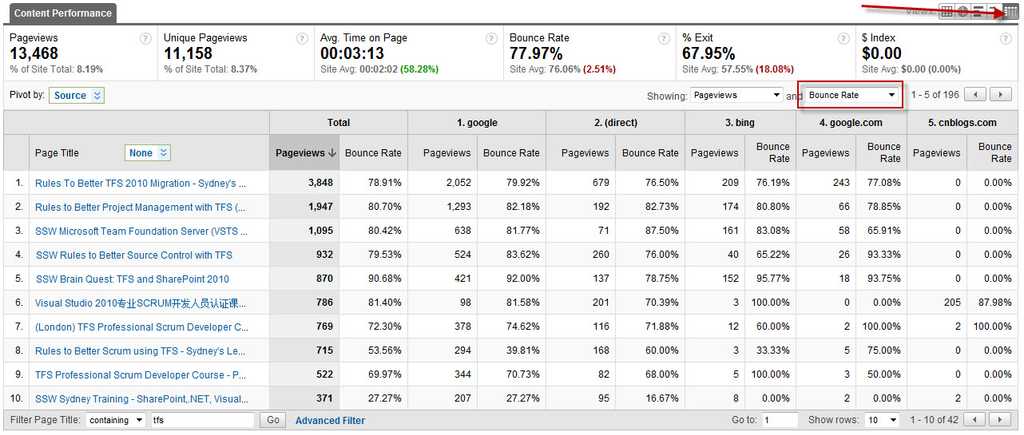
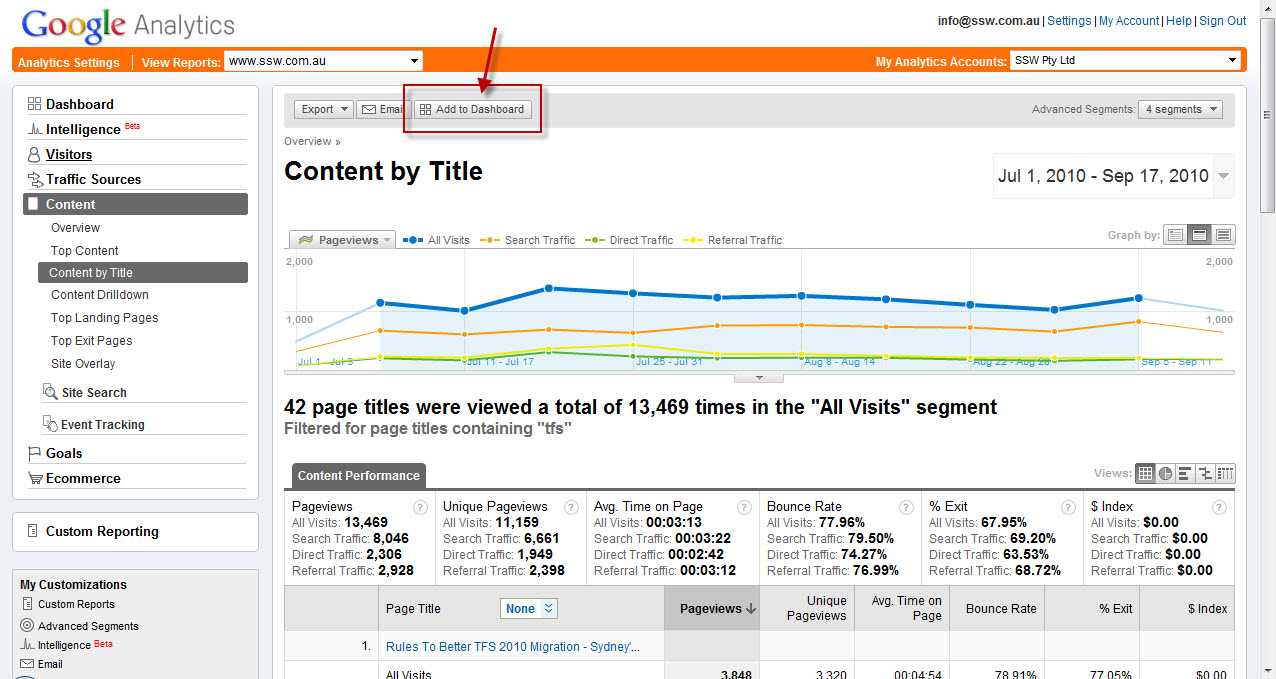
Figure: You can also show bounce rate by including it in the second dropdown. Other metrics include Average Time on Page and Exit rate 6. Add To Dashboard
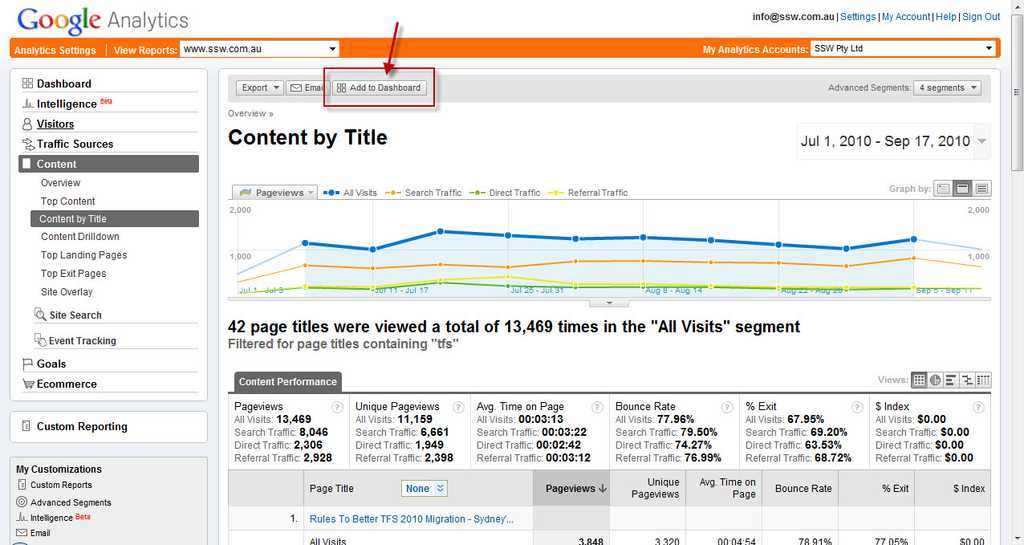
Figure: Add the Report to your Dashboard 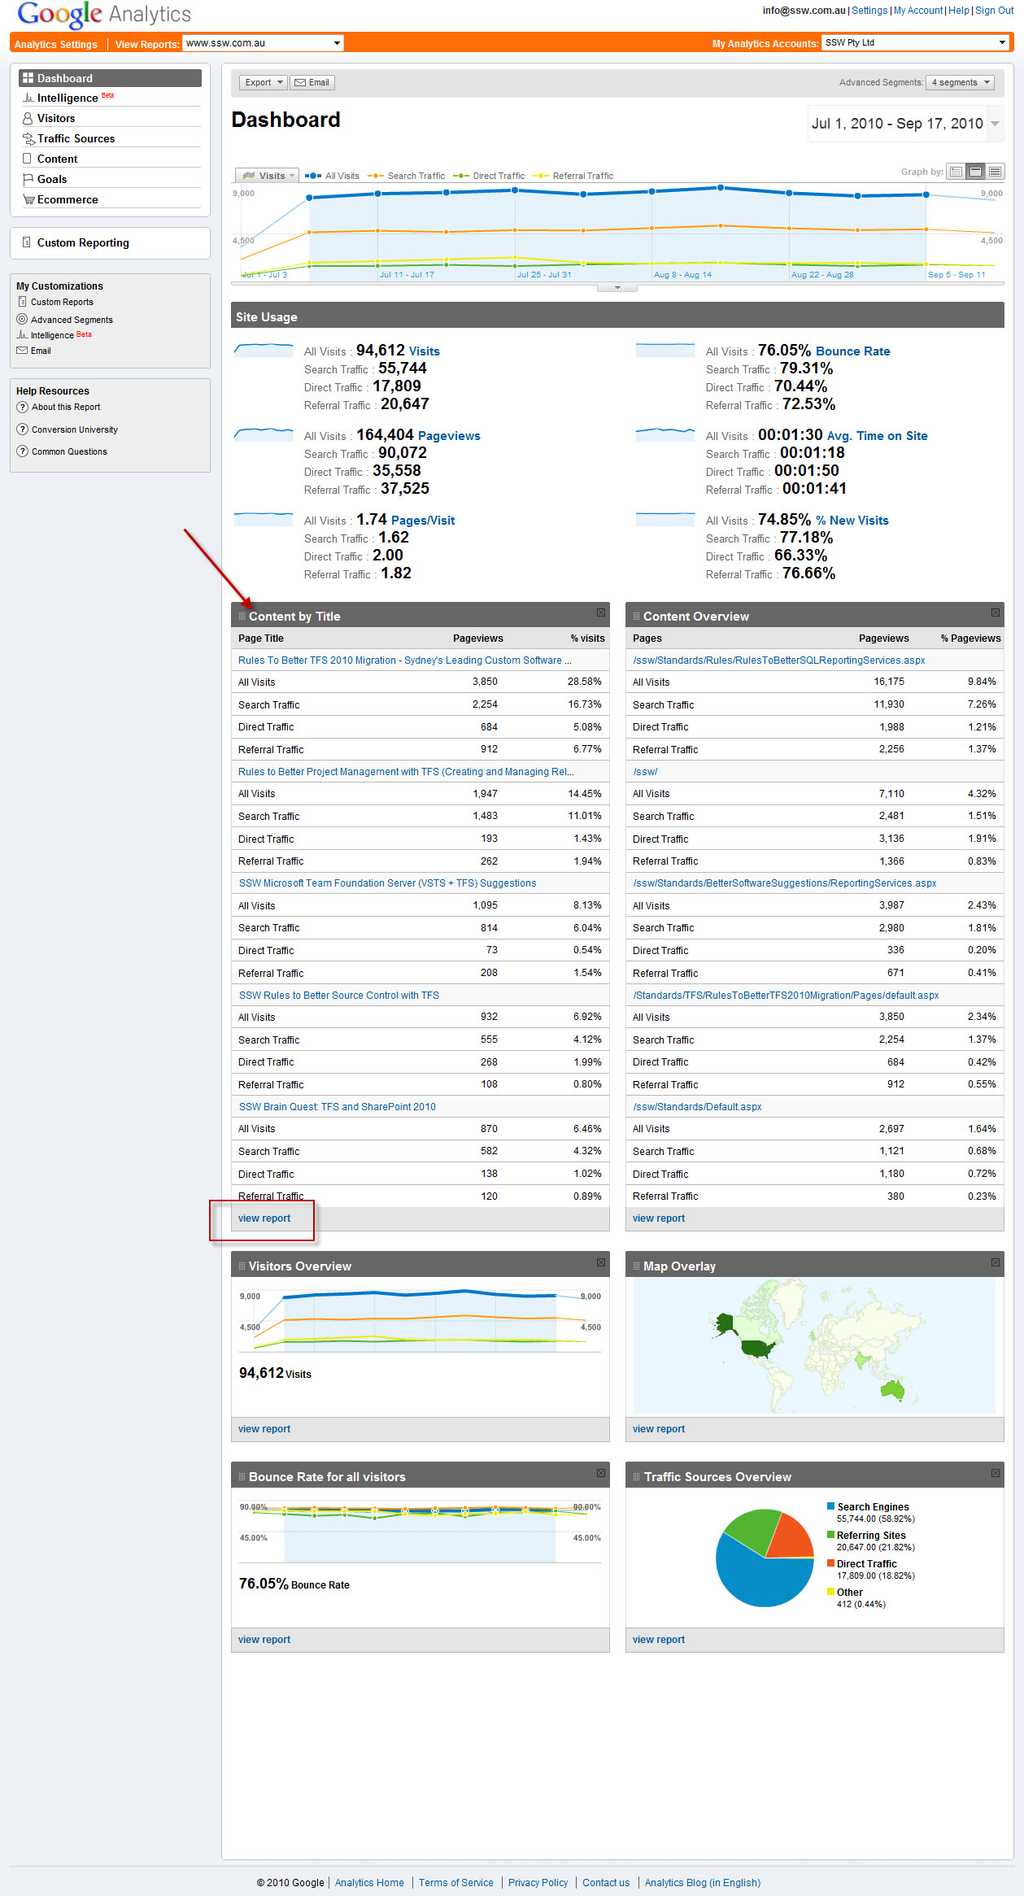
Figure: Now the report will be available from the Dashboard to check regularly. Click the ‘view report’ link to drill into the details of the above