Rules to Better RayGun - 4 Rules
RayGun is a paid cloud based application monitoring product that does Crash Reporting and User Monitoring for your web or mobile application. Raygun makes triaging and reporting exceptions in your application easy by grouping the exceptions and tracking them against deployments so you can easy see if they are new exceptions, recurring exceptions or regressions.
Check out the video below to see how you can use RayGun as part of your DevOps.
Your team should always be ensuring that the health of the application is continually improving.
The best way to do that is to check the exceptions that are being logged in the production application. Every morning, fix the most serious bug logged over the last week. After it is fixed then email yesterday's application health to the Product Owner.
There's traditional error logging software like Log4Net or Elmah, but they just give you a wall of errors that are duplicated and don't give you the ability to mark anything as complete. You'll need to manually clear out the errors and move them into your task tracking system (Azure DevOps/VisualStudio.com).
This is where RayGun or Application Insights comes into the picture. RayGun gives you the following features:
- Grouping exceptions
- Ignoring/filtering exceptions
- Triaging exceptions (mark them as resolved)
- Integrations to TFS/VisualStudio.com to create a Bug, Slack
- Tracking the exceptions to a deployment
- See which errors are occurring the most often
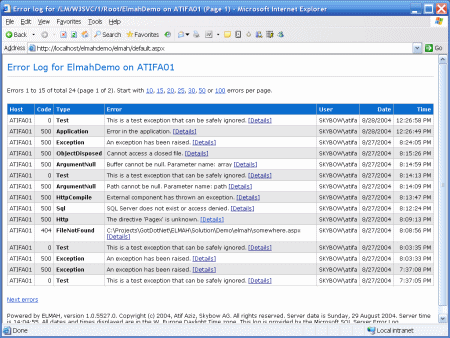
Figure: Bad example - Elmah gives you a wall of exceptions and no way to flag exceptions as completed To: Adam Subject: Raygun Health Check for TimePro Hi Adam
Please find below the Raygun Health Check for TimePro:

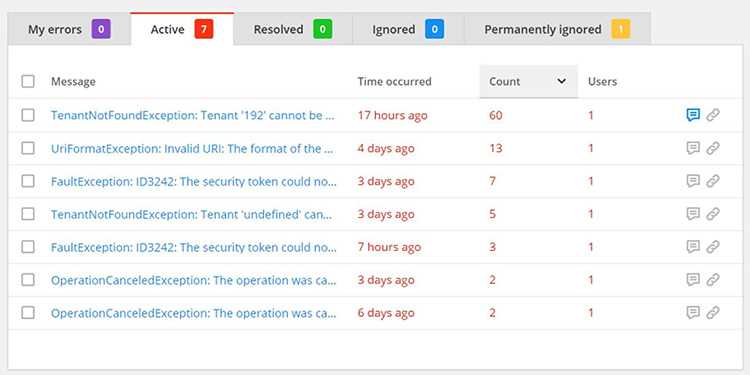
Figure: Raygun health check for TimePro in the past 7 days 
Figure: Resolved issues in the past 7 days 
Figure: The next issue to be worked on < This email is as per https://ssw.com.au/rules/how-to-handle-errors-in-raygun >
Figure: Good example - Email with Raygun application health report
TFS/VisualStudio.com is the source of truth for product development, so how do you get issues in RayGun into TFS? Thankfully there’s a built in integration that lets you do that.
- Under Integrations
- Select Visual Studio Team Services
- Connect to your TFS or VisualStudio.com instance

Figure: Link RayGun with TFS/VisualStudio.com Now under the crash report, you have to option to create a PBI and link it to the crash report.
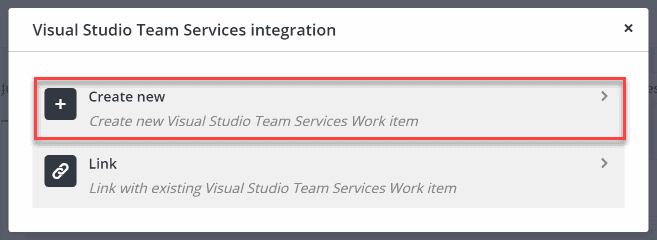
Figure: Create a new PBI or link to an existing PBI Now you can see which RayGun create reports have already been added to the backlog.

Figure: Link RayGun with TFS/VisualStudio.com RayGun is a useful tool to use for your DevOps. Check out our rule “Do you know how DevOps fits in with Scrum?”
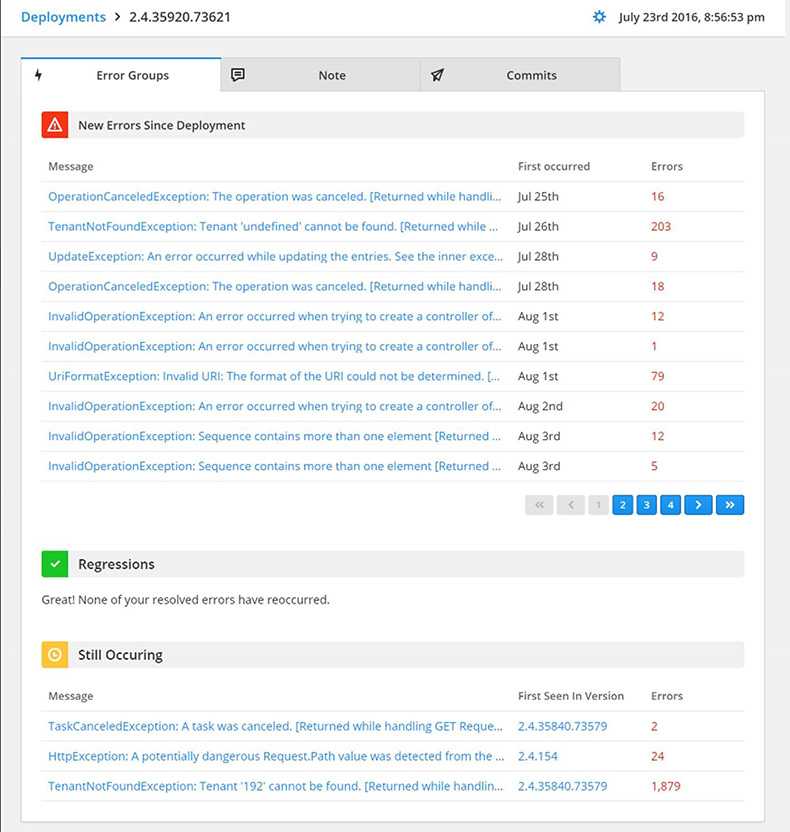
One of the best features of RayGun is the ability to track crash reports against deployments. This feature allows you to tell if a particular deployment has introduced a lot of new bugs or caused a regression of exceptions.
To set it up:
- Under Deployments
- Select Octopus Deploy (Set up)
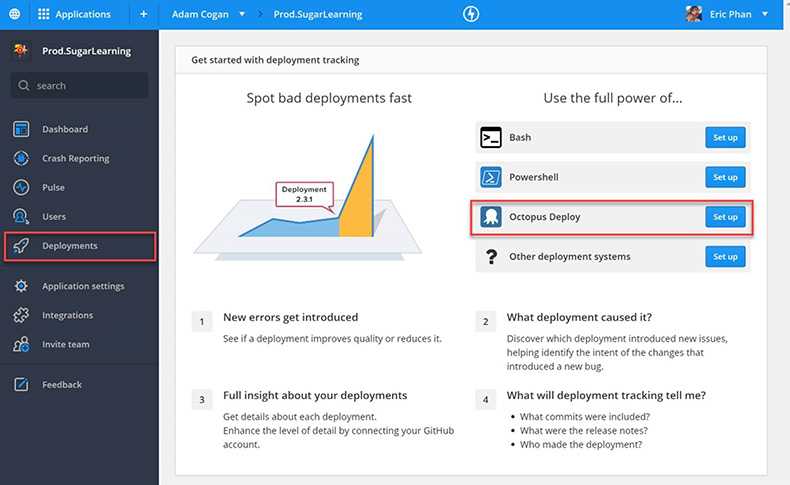
Raygun will product you with a PowerShell script to add into your octopus deployment steps that will call the RayGun API and log a new deployment 3. Trigger a new deployment 4. Then you’ll see the deployment in RayGun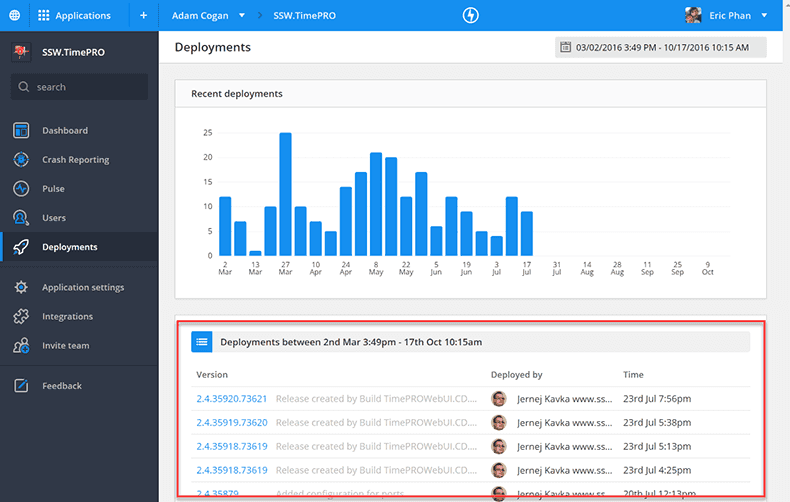
Drilling into a deployment you’ll see:- New errors
- Regressions
- Recurring errors
You should always keep on top of your RayGun crashreporting and not let the errors spiral out of control. If use RayGun with a web application, then you’ll frequently get a lot of errors with robots scanning the site and creating 404s.

Figure: Bad Example – Most of these errors are 404s cause by automated tools scanning for vulnerabilities Luckily RayGun has built-in filtering to hide these frequent exceptions.
To enable filtering:
- Under Crash Reporting > select Filtering
-
SSW recommends you turn on the following rules
- Discard any requesters where the user-agent is a known crawler bot
- Discard any request for non-existent resources (404)
- Discard any requests related to phpMyAdmin access attempts
Now you should have a nice clean crash report page with actual errors.
